


Snapshot
Global manufacturing purchasing managers' indices (PMIs) continue to inflect to the upside, and exports are picking up in places like South Korea, indicating that the manufacturing (inventory) cycle is gaining momentum. While inventories always need to be replenished, easier financial conditions and generally improved risk appetite do lend support for early orders, which tend to be self-reinforcing as supply chains regain momentum.
Certainly, the artificial intelligence investment frenzy is feeding into high demand for semiconductors and memory chips, but manufacturing and export demand is broadening to a variety of goods reflected in dry bulk shipping costs that are rising for the first time since sinking into the 2022-2023 doldrums. The downturn in manufacturing had been thought as a precursor to recession, but apparently buyers just needed to adjust to the post-COVID shocks of rolling shifts in demand.
These improving dynamics defy conventional logic of what one would expect from one of the most aggressive tightening cycles in history. However, if one considers the magnitude of the 2020 expansion in money supply, of which quantitative tightening (QT) removed only just a small portion while fiscal largesse continues, there is still significant excess liquidity sloshing around, perhaps transmitting to resilient demand and cash flow that so far exceeds the headwinds of higher rates.
Cross-asset1
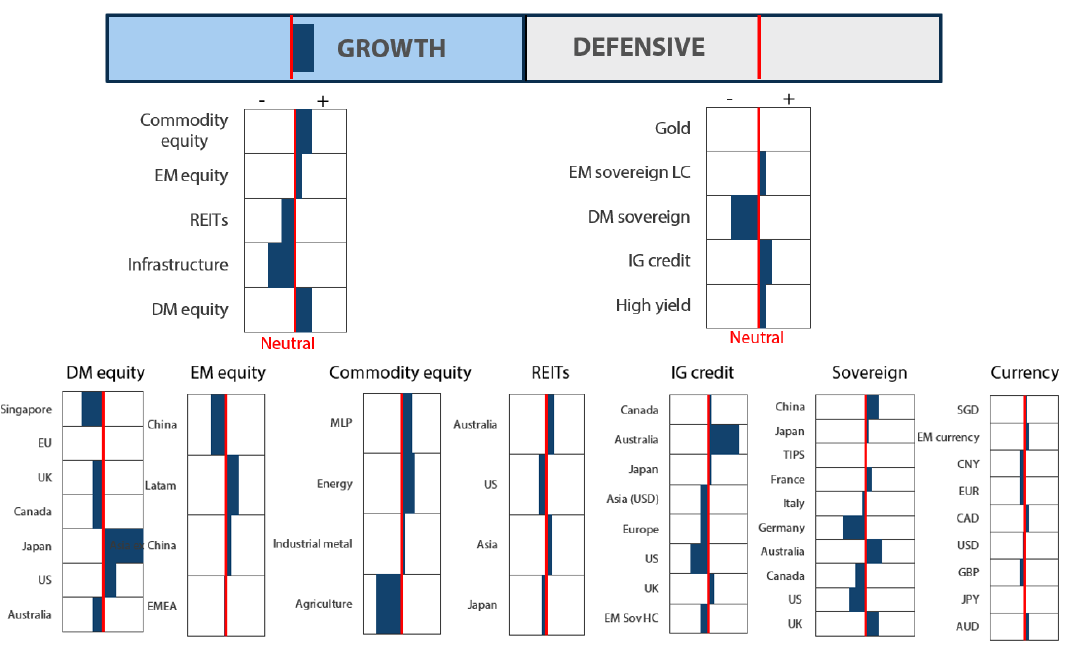
We increased growth to a stronger overweight while maintaining a neutral defensive score. The US economy looks to be gaining momentum, and growth elsewhere is also improving partly on account of the lift from the global manufacturing cycle as inventories need to be restocked. While the equity rally had been narrow in breadth (think Magnificent Seven), broadening growth has the potential to lift the earnings across other sectors.
From a cross-asset perspective, while the growth and earnings outlook is potentially improving, credit spreads are relatively tight—and therefore less attractive compared to several months ago on a relative value basis. Rate volatility also looks to be finally settling to more normal levels, giving better visibility to long-term rates while also offering a firmer foundation for discounting appropriate equity valuations.
We still see value in secular growth opportunities including US tech and Japan structural reforms, and the potential for a broadening opportunity set. We already have an elevated position to commodity-linked equities that lend exposure to upside growth surprise. This month, we lifted both developed and emerging market (EM) equities to add to cyclical growth, funded from infrastructure and REITs. On the defensive side, we reduced gold to neutral, adding in equal parts to overweights in high yield and EM local currency, favouring yield opportunities with still appropriately sized protection.
Asset Class Hierarchy (Team View2)
Research views
Growth assets
Growth assets have had a strong run since late October 2022 and may be due for a breather. European equities have recently gained momentum, and Japan is among the top performing markets year to date. Once again, the markets contemplated the prospect of the Bank of Japan (BOJ) taking further monetary policy normalisation steps after ending negative interest rates on 19 March, perhaps turning Japanese yen (JPY) weakness into strength while taking the steam out of the equity rally. However, our intermediate and long-term view remains bullish for Japan and now neutral on Europe as the power of reflation likely outweighs the pain of higher rates.
Rising rates not always a headwind
Over the deflationary years, prospects for the Japanese equity market were mainly associated with views on the currency (yen). Yen weakness means more competitive exports and better earnings, which is still true. The yen also used to be more connected to the US dollar where dollar weakness is often a sign of improving global demand, which also tended to weaken the yen, giving a further tailwind for Japanese equities. As Japan has ended its negative rate policy, does this mark a turning point for the yen, from weakness to strength? Does this also mean equities will go from strength to weakness? We do not think so.
The yen could eventually strengthen on the back of higher rates, but this is not necessarily bad for equities, in our view. In fact, Europe lifted rates from negative levels all the way up to +4% without the disastrous consequences that so many predicted.
Low rates are growth positive, and while negative rates were thought to be even more of “a good thing”, the European Central Bank (ECB) and the BOJ’s experiment in shifting to negative rate territory ostensibly did not work out so well—economically, or as reflected through relative performance in their respective equity markets.
In the case of Europe, the ECB pushed the policy rate into negative territory in mid-2014, which was originally met with exuberance—European equities outperforming the global broad market for about one year and then strongly underperforming for the eight years that followed. Did negative rates help the economy? We doubt it.
Europe exited negative rates in 2022 and, surprisingly to many (including us), the equity market strongly outperformed the rest of the world on the back of decent growth and earnings. The European recovery did stall in 2023, driven to some degree by higher rates but also weak demand from China and broadly high levels of inventories. However, the recession looks shallow with some improvements on the horizon driven by an upturn in the global manufacturing cycle.
Chart 1: European equities (EURO STOXX 50)/ACWI vs. policy rate
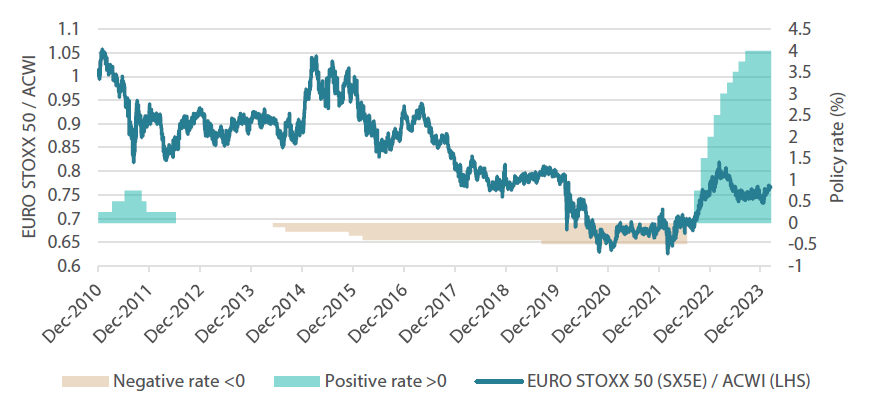
Source: Bloomberg, March 2024
Arguably, Europe benefitted from exiting deflation, and positive rates likely helped the normal function of credit markets and money creation. This is positive. Our view is that negative rates are more a symptom of economic malaise rather than a source of stimulus. Exiting negative rates may well be a symptom of economic recovery.
In Japan, Abenomics had been working well with rates at just 10 basis points (bps) through 2014. However, when the BOJ followed the ECB in cutting rates into negative territory in 2015, growth looked to be stalling. No matter what the cause, negative rates in Japan did not appear to support the economy or the equity market in relative performance terms.
Chart 2: Japanese equities (TOPIX)/ACWI vs. policy rate
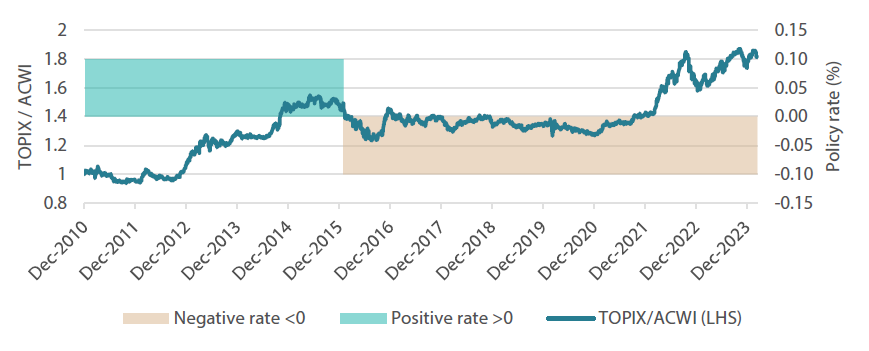
Source: Bloomberg, March 2024
We worry less about the BOJ hiking rates, mainly because we do not really believe that negative rates supports an economy or its equity markets. Exiting negative rates in Europe arguably might have helped the region’s economy and the equity markets, while euro strength did not hamper the recovery either.
The yen can strengthen on the back of normalising rates, but the combination of reflationary conditions and a cautious BOJ suggests that yen strength would be limited and not become a hindering headwind. Moreover, rate differentials are so wide that it is difficult to see how the yen could shift to a sustained rally even after rates begin to lift.
Conviction views on growth assets
- Commodity-linked equities: Inflation is looking stickier, much as we predicted, and it is supporting the equities complex, which is a decent hedge to stickier inflation.
- US secular growth: Consolidation may be underway, which would be healthy after a relentless four-month rally. Top line growth remains strong as are margins. US secular growth expressed in technology also offers balance to the portfolio where commodity-linked and Japanese equities come with a value tilt.
- Neutral to Europe: We had difficulty seeing European equities recover in the midst of a slowdown before rate cuts even started. However, Europe can benefit from an improving manufacturing cycle and eventually lower rates on the back of a relatively shallow slowdown.
Defensive assets
Changes within defensive assets remain relatively small; in sovereigns, we added to those of France and China where conditions are more favourable for impending rate cuts over other geographies. We reduced US Treasuries and Australia sovereigns at the margin to fund this shift. As bond volatility continues to decline, the biggest recent price moves have come from the gold market this month and to a lesser extent, the yen. This month, we take a closer look at the defensive role of gold relative to recent price moves.
Gold and real rates
Gold has risen steadily without much fanfare or speculative interest, but markets took notice of the nearly 6% jump from the end of February to handily break the all-time high (ATH) of US dollar (USD) 2,163 per ounce. In recent years, spikes in gold prices have normally been associated with crisis—like the Russia-Ukraine war shock lifting gold to USD 2,050 in March 2022 and nearly reaching the same level again in May 2023 following the banking scare. Still, neither crisis quite lifted gold to the prior ATH of USD 2,063 high struck in August 2020, following the massive stimulus released into the system in the midst of the COVID-19 pandemic.
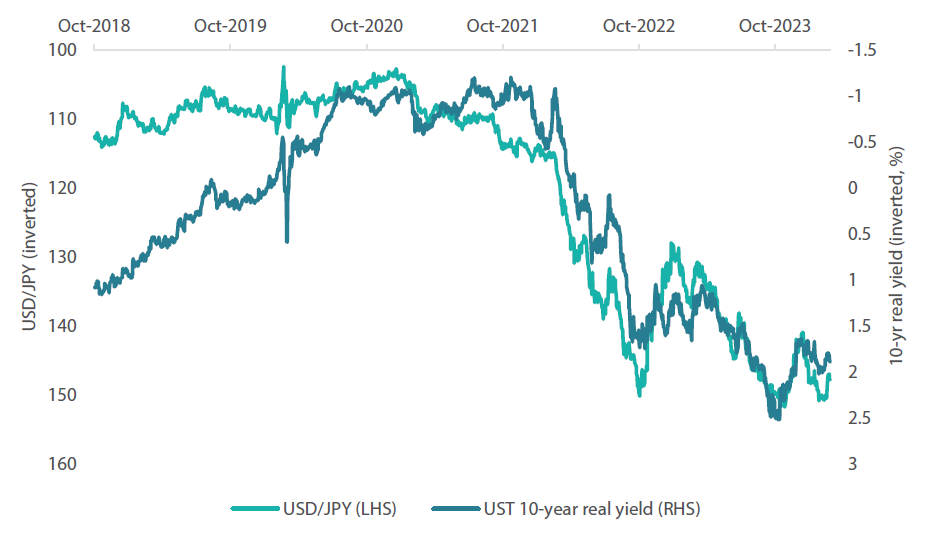
Over the short term and outside of crisis, gold price action is typically driven by the relative attractiveness of real yields. If real yields go up, investors may shed gold positions given that its cost of carry is negative and more attractive yields exist elsewhere, and if they come down, the allure of gold’s store of value attracts buyers back. This latest rally reflects the condition of real yields coming down (all the way to July 2023 levels), except the size of the move seems exaggerated.
Chart 3 shows the relative price action of gold versus real yields (inverted), showing that the zigging and zagging over the short term can largely be explained by shifts in real yields. However, when one expands the view back to 2018 when the US Federal Reserve (Fed) was last at the peak policy rate (just 2.5% versus 5.5% today), gold is on a clear uptrend—soaring 77% (35% in real terms) over the period while real yields should be more attractive at 1.88% today versus 1.15% back in 2018.
Chart 3: Gold vs. US real yield (inverted)
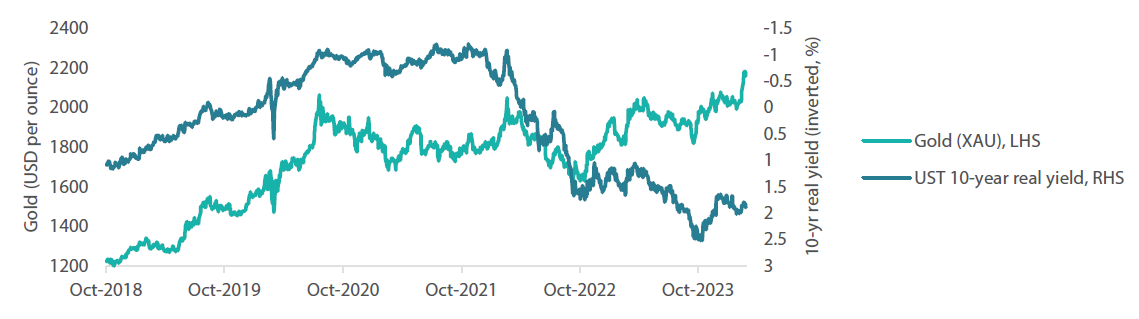
Source: Bloomberg, March 2024
Is gold expensive given its real price appreciation since 2018? Perhaps, but not necessarily. There are a couple of differences between peak rates in 2018 versus today. First, the Fed’s balance sheet is 87% larger than it was in late 2018 (46% in real terms) while money supply (M2) is contracting but still 47% larger than in late 2018 (19% in real terms). Second, the US fiscal deficit is also running hot at -6.45% of GDP today versus -3.75% in 2018. It is not specifically clear yet what is driving gold to current levels, but the fundamentals do not necessarily suggest it is too expensive.
While we do not see a fundamental reason why gold is too expensive for the protection it offers in a portfolio structure, real yields have already lifted back to the more reasonable levels we saw in early March. This may have temporarily stopped gold’s rally.
Japanese yen versus real rates and the BOJ
Early in March, the yen also found a boost along with gold, with many attributing the currency’s move to impending rate hikes by the BOJ, which went on to raise rates on 19 March. The yen subsequently weakened again towards the end of the month amid prospects of Japan’s interest rates remaining much lower than those of other countries. Similar to gold, the yen has a negative carry, responding similarly to the precious metal with shifts in US real yields. The yen’s rally early in March occurred along with the compression of real rates and the currency gave up those gains as US real yields have pushed back to prior levels. All of this is to say that the bout of yen strength we saw early in March was due to usual market trends and shifts in US real yields, rather than anticipated BOJ hawkishness.
Chart 4: US real yields (inverted) vs. yen (inverted)
Source: Bloomberg, March 2024
In any event, the BOJ needs to “normalise” rates meaning that negative rates make little sense where inflation pressures may have the upper hand, and neighbours around the world have correspondingly lifted rates putting undue pressure on the yen to depreciate further which adds to inflation pressures. Still, the BOJ needs to be careful, having over-tightened in the past causing Japan to re-enter deflation.
Rate hikes are fully priced in terms of expectations, and we doubt the BOJ is going to surprise by being more hawkish than the market expects, meaning that the yen is unlikely to destabilise into strength.
Gold in yen terms
While the yen has depreciated 24% relative to the dollar, gold in yen terms has appreciated 120% since 2018. So far, the yen has not kept up with gold in the recent rally, meaning that gold remains a decent hedge for Japan investors.
Chart 5: Gold in yen terms vs. USD/JPY
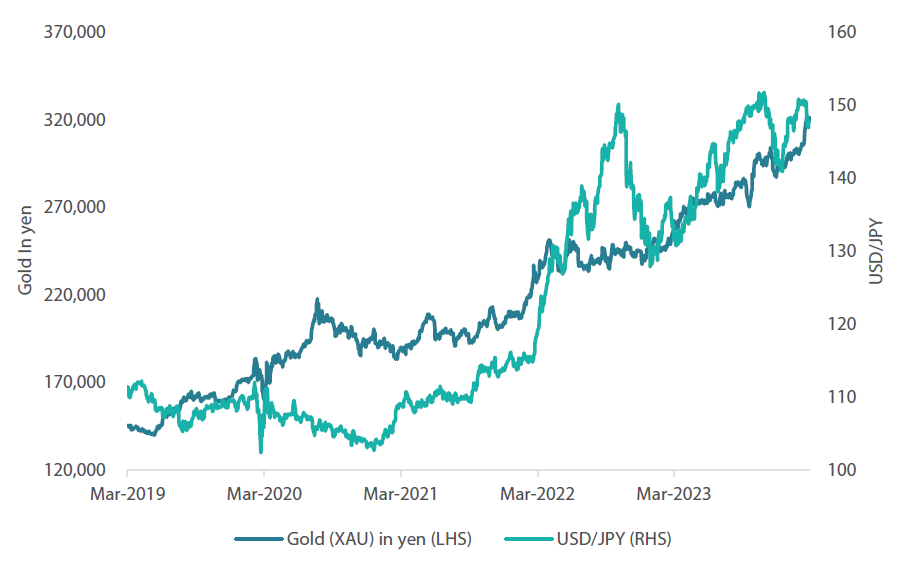
Source: Bloomberg, March 2024
Conviction views on defensive assets
- Short-dated investment grade credit: Credit spreads remain at fair levels but inverse yield curves still seen in many markets make longer-dated credit less attractive. Until curves steepen, shorter-dated credit is likely to remain our preference.
- Gold is still an attractive hedge: Gold has been resilient in the face of rising real yields and a strong dollar, while proving to be an effective hedge against geopolitical risks and sticky inflation pressures.
- Attractive yields in EM: Real yields in this sector are generally very attractive, and we prefer quality EM currencies against the backdrop of a generally weaker dollar.
Process
In-house research to understand the key drivers of return:
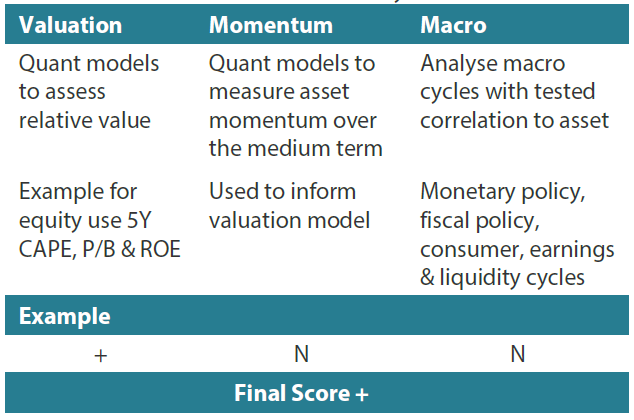
1 The Multi Asset team’s cross-asset views are expressed at three different levels: (1) growth versus defensive, (2) cross asset within growth and defensive assets, and (3) relative asset views within each asset class. These levels describe our research and intuition that asset classes behave similarly or disparately in predictable ways, such that cross-asset scoring makes sense and ultimately leads to more deliberate and robust portfolio construction.
2The asset classes or sectors mentioned herein are a reflection of the portfolio manager’s current view of the investment strategies taken on behalf of the portfolio managed. The research framework is divided into 3 levels of analysis. The scores presented reflect the team’s view of each asset relative to others in its asset class. Scores within each asset class will average to neutral, with the exception of Commodity. These comments should not be constituted as an investment research or recommendation advice. Any prediction, projection or forecast on sectors, the economy and/or the market trends is not necessarily indicative of their future state or likely performances.
