Snapshot
With the first blows of US President Donald Trump's trade war being delivered in April, volatility rose substantially across most financial assets as risk assets took the news poorly. Despite this, the MSCI All Country World Index rose by 0.74% in US dollar (USD) terms during April, after being down some 10% over the first eight days of the month. The announcement of reciprocal tariffs saw the Trump administration applying tariffs to all countries globally, which eventually ignited a tit-for-tat increase in tariffs from China, with the final tariff weights of over 100% making trade between the two countries prohibitively expensive. However, throughout the month, the stance from the US softened, which saw the tariffs implementation being delayed, breathing life back into markets. Throughout April, the VIX volatility index rose from relatively benign levels to over 50, showing levels of implied volatility that typically only come during financial distress or a global recession. Outside of the US, some solace came from the market anticipating potential trade deals, with the UK and the US announcing an agreement. With potential trade deals in mind, we think the initial “worst case” tariff fears were potentially overdone and have stuck with our overweight on the growth score. Meanwhile, as the first-quarter earnings season begins to wind down, we also examine the better-than-expected earnings results.
Within fixed income, the market was equally as volatile, with the 10-year US Treasury (UST) yields falling to as low as 3.86% before rising to 4.56%. The final yield eventually finished the month down only 4 basis points (bps) at 4.16%. Liquidity in the market appeared troubled at certain points, with the moves fuelled by a fear of a global recession, followed by the unwinding of basis trades which exacerbated market movements. With the trade war intensifying, a number of additional rate cuts were priced into the markets, with the US Federal Reserve (Fed), European Central Bank (ECB), Bank of England (BOE) and Reserve Bank of Australia (RBA) now expected to ease an additional 50 to125 bps over the next 12 months. While the bond market was somewhat illiquid in April, this may prove to be positive for fixed income and provide support to bond yields and credit spreads in the coming months. To that end, we have upgraded several classes within defensives at the expense of gold—which have continued to sparkle but looks over-stretched. During the month, the Bloomberg Global Aggregate Bond Index rose 2.94% in USD terms; this, in addition to the rebound in risk assets at the end the month, saw multi-asset portfolios perform adequately. In spread products, high yield sold off relatively aggressively to start the month, rising some 100 bps. However, as equity markets recovered, spreads contracted to end the month only 40 bps wider.
Cross-asset 1
For the month of April, we maintained our overweight to growth assets, while increasing our defensives marginally.
Despite the drawdown in equity markets, we decided to maintain our overweight growth scores as we viewed the market's reaction as somewhat overdone to the original tariff announcements. Currently, we expect that a number of trade deals will likely be completed, with countries such as the UK, South Korea, India and Japan potentially able to achieve more favourable terms than the original announcement. In addition to this, the US administration is readying additional tax cuts, which they are looking to fast track in order to help offset the negative backlash from its trade policies. Furthermore, outside of the US, we still view the rate-cutting cycle favourably, and this could help offset some of the slower growth that will be generated from what appears to be misguided US policy. For defensives, we increased our score marginally, and this brought with it an increase in our duration profile, extending our portfolio into longer dated maturities. During the month, credit spreads sold off and we saw this as an opportunity to increase our exposure to high yield, where US spreads sold off aggressively.
Within growth assets, we maintained our overweight in developed market (DM) equities and increased our overweight position in emerging market (EM) equities.
Within DM, we are still overweight in the US on the back of better visibility driven by secular growth themes. We downgraded the UK to underweight and moved capital to the higher beta countries like Japan and Europe. As a result, we neutralised our position in Japan on expectations of the yen weakening on the Bank of Japan (BOJ)'s shift to a less hawkish tone. The longer term structural story of improving corporate governance and earnings growth momentum in Japan remains intact. Likewise, we neutralised Europe on the back of the recent market correction, and we believe that the region's corporate earnings should turn positive in the latter half of the year with the ECB cutting rates more aggressively than the Fed. The weakening of the euro from hereon may also be positive for Europe. We continue to like Singapore for their attractive dividend yields and resilient economy.
Within EM, we continue to favour selective countries—like India—which are expected to benefit from domestically-driven economies and structural long-term growth stories. Likewise, we retained our overweight position in Taiwan, which is a beneficiary of the current global tech upcycle.
We maintained our neutral position in commodities. Within commodities, we kept energy at neutral as Trump's pro-energy policies are expected to benefit the sector via increased volumes. We increased our underweights in infrastructure as we see better risk rewards in other asset classes.
Within defensives, our view on the asset class is improving, as the asset class is beginning to perform on steeper curves, somewhat slower economic data, rate cuts and policy uncertainty. We expect US interest rate policy will be toned down over the coming months, with the Fed taking a slower approach to rate cuts. However, central banks outside of the US likely do not have the luxury to take such an approach, and we expect them adopt more dovish interest rate policies in the near term. We increased our DM Sovereign score to neutral. Within sovereign allocations, the RBA may need to ease rates by 100 bps as Australia's inflation has moved towards the bottom end of its band and the risk of China slowing from trade tensions is high. The ECB will also likely continue to ease, as the region's growth remains anaemic and its inflation remains only marginally above the central bank's 2% target. We also increased our investment grade (IG) credit and high yield scores in April, as the spread sell-off makes owning short dated spread product somewhat attractive. These trades were funded by downgrading our gold scores, as the asset has put together extremely strong returns over the past 18 months. We still think that gold is a good hedge to hold in this environment. However, our long-term valuation metrics is beginning to flash worrying signs amid the precious metal's recently strong performance, which will be the topic of this month's Balancing Act.
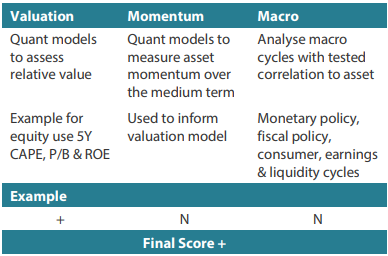
1 The Multi Asset team's cross-asset views are expressed at three different levels: (1) growth versus defensive, (2) cross asset within growth and defensive assets, and (3) relative asset views within each asset class. These levels describe our research and intuition that asset classes behave similarly or disparately in predictable ways, such that cross-asset scoring makes sense and ultimately leads to more deliberate and robust portfolio construction.
Asset Class Hierarchy (Team View 2 )
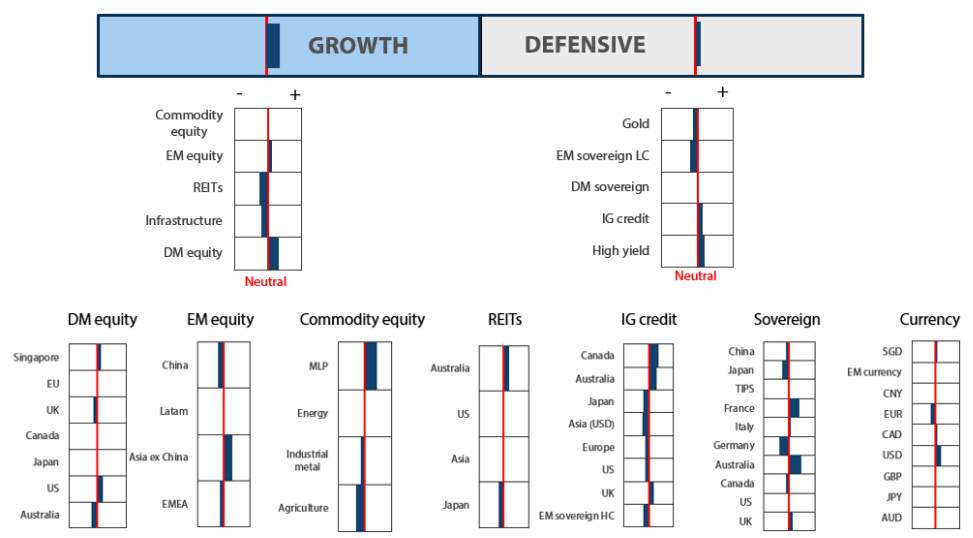
2 The asset classes or sectors mentioned herein are a reflection of the portfolio manager's current view of the investment strategies taken on behalf of the portfolio managed. The research framework is divided into 3 levels of analysis. The scores presented reflect the team's view of each asset relative to others in its asset class. Scores within each asset class will average to neutral, with the exception of Commodity. These comments should not be constituted as an investment research or recommendation advice. Any prediction, projection or forecast on sectors, the economy and/or the market trends is not necessarily indicative of their future state or likely performances.
Research views
Growth assets
Growth assets remain appealing, as we believe that global economic growth should remain resilient despite the macro headwinds on import tariffs by the US. Sentiments remain negative despite the rhetoric towards a global recession that appears to be subsiding as the US announces more trade deals. US economic data so far has shown signs of fading but it is not collapsing as the markets expected. Inflation is also softer than expected, which allows central banks globally to cut rates to support growth. So far, corporate profits in the US continue to be strong while guidance were more muted given the current uncertain landscape. Outside of US, we are seeing signs of corporate earnings weaknesses as business are disrupted by the ongoing trade wars.
Overall, earnings growth currently remains on an upward trajectory, providing support for growth assets. However, uncertainties persist due to ongoing trade tariffs discussions. Clarity may emerge over the next few months as these trade deals are potentially finalised. In the short term, potential positives could stem from corporate or income tax cuts, which should be supportive of continued economic activities in the US.
Q1 earnings season scorecard
As the first quarter (Q1) earnings season draws to a close, more than 90% of the S&P 500 companies have reported their earnings. Results have been more resilient than expected, with 77% of these companies surpassing market expectations, exceeding the historical average beat rate of 74%. Sales beats, however, were below the historical mean, with only 51% of the companies reporting beats compared to the 55% historical average.
The earnings surprise for Q1 was very strong at 8%, marking a peak performance over the past two years despite the current uncertainty (see Chart 1, which shows the average degree of the earnings and sales beats versus the consensus). However, the Q1 sales beat was slightly below 1.0%, falling beneath the average of the past four quarters. Commentary from the companies was muted, with many citing uncertainties due to the import tariffs. Most companies are either maintaining or withholding guidance until further clarity emerges in the coming months.
Chart 1: Degree of earnings surprise vs consensus was even greater than the previous quarter
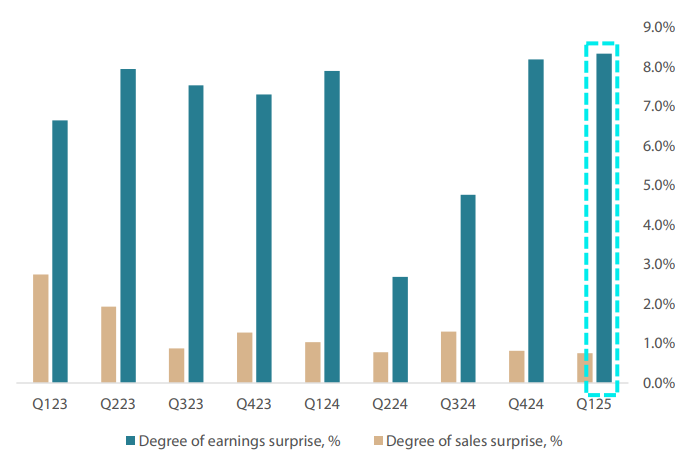
Source: Bloomberg, May 2025
Taking a look at sector earnings, we are starting to see a broadening range of sectors excelling beyond the usual leaders like technology and healthcare. Cyclical sectors such as industrials, financials and materials registered strong earnings beats and surprises. However, defensive yield sectors such as staples, utilities and energy appear to be struggling in the current environment.
Table 1: Outperformance by wide range of sectors shows earnings broadening beyond technology sector
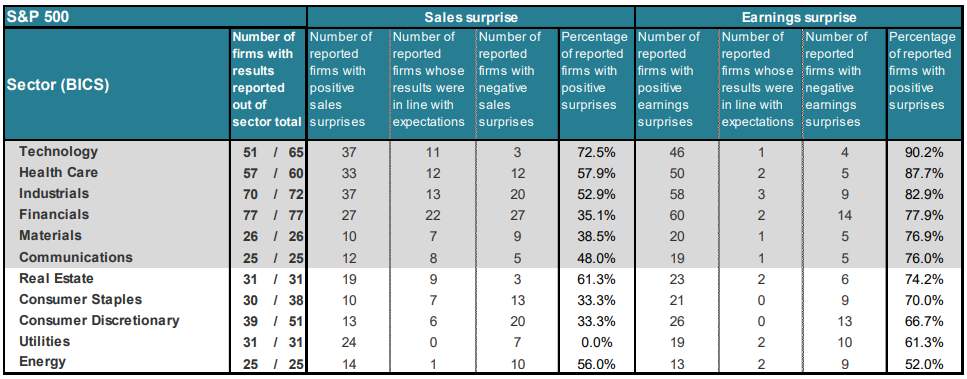
Source: Bloomberg, May 2025
The reporting season has seen technology emerge as best-performing sector, followed by discretionary. Both sectors rallied strongly following a pause in import tariffs by Trump, prompting investors to get back into growth sectors. Likewise, industrials and communication services also saw gains amid the risk-on trades as investors rotated capital out of the more defensive sectors like healthcare and staples into cyclical sectors.
Assessing the market's earnings growth expectations, it is worth noting that Q1 stands out with a strong year-on-year (YoY) earnings growth rate of 12%. Projections indicate that earnings growth estimates will continue to improve over the next few quarters despite the ongoing uncertainties (see Chart 2). We believe upside risks remain, contingent upon trade deal de-escalation in the coming months and potential tax and interest rate cuts in the coming quarters. These factors are expected to have a positive impact on risk assets.
Chart 2: YoY earnings and sales growth estimates expected to continue improving
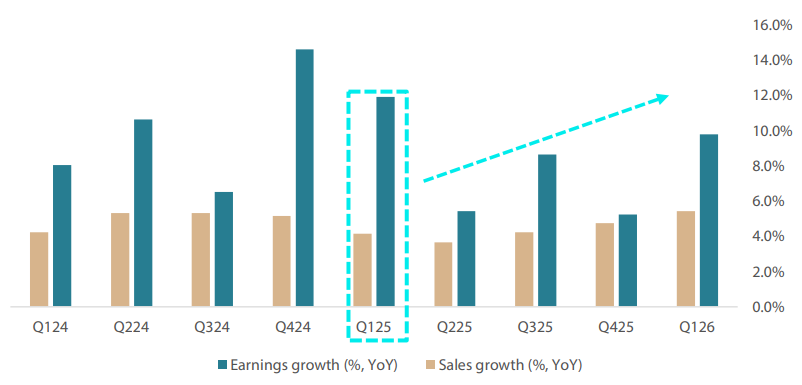
*Estimates from Q2 2025 onward
Source: Bloomberg, May 2025
Conviction views on growth assets
- Maintain overweight exposure to US growth for now : Following the recent selloff, we recognise the short-term impact of equity positions on returns, but we also do not want to overreact and sell at valuations that historically have been favourable levels to increase exposure. There remains potential for positive surprises in the market, such as responses from central banks and import tariffs relief. We see current US market valuations as attractive and are looking for catalysts that could drive further improvements.
- Overweight on Singapore : We still have an overweight position in Singapore due to its defensive attributes. Singapore offers high dividend yields and low beta. The market is also strong in terms of relative valuation metrics and are least likely to be targeted by Trump's tariffs policies, given Singapore's trade balance deficit position.
- Exposure to EMs increased : Within EM, we prefer selective markets, such as India, which benefit from domestically driven economies and structural long-term growth stories.
- Neutral on commodity-linked equities : We continue to believe that commodity-linked equities will keep providing good diversification against inflation in the longer term. The fundamentals of the sector remain compelling due to both cyclical and secular factors.
Defensive assets
Defensive assets performed well in April, as the risk-off tone throughout markets saw bonds and gold in particular perform well. With markets now expecting a slowdown in economic growth from the trade war, central banks across the world will likely continue their easing cycles and pull rates lower in the coming months. This should benefit defensive markets, and potentially lead to additional steepening of bond curves which will make the asset class more attractive than the past 18 months. Gold has continued to be the standout performer, rising some 25% year to date with an almost 6% return coming in April. While we have been using gold as a defensive hedge across our portfolios, the short and long-term signals are beginning to deviate. This month's Balancing Act looks at the short term where gold is driven by uncertainty against our long-term valuation metrics, which have led to gold holdings in portfolios to be downgraded.
Gold - what a run
Since the beginning of 2023, gold has increased by almost 80% in USD terms, outpacing the S&P 500 by nearly 30% and lagging the performance of the NASDAQ by only 3% in what has been a bull market for technology stocks. Gold's performance has been exceptionally strong since Trump was inaugurated, as the precious metal has well outperformed equities to kick off 2025. We have long proposed using gold as a defensive ballast of the portfolio, as it provides a hedge against inflation, prolific government spending and the risk of monetisation in a world full of government debt. However, more recently, we have begun to take a more cautious view on gold, as the interplay between the short term outlook and long-term valuation metrics becomes more uncertain than in prior months.
Starting with the short-term view, a strong case can still clearly be made for gold. As Chart 3 below shows, the year-on-year change in the price of gold has been following how uncertain small businesses are—the more uncertainty in the economic environment, the more gold has rallied. Given that there appears to be no end in sight for Trump's trade war, it would stand to reason that small businesses are going to face more uncertainty over the coming months as the full effects of reducing trade with China could have very large economic impacts. This should be bullish for gold.
Chart 3: Gold vs uncertainty

Source: Bloomberg, May 2025
However, from a longer term perspective, the gold price is starting to become expensive on valuation metrics. One of the key valuation metrics that we use within our process is the gold price relative to the money supply—the idea being that gold has a relatively finite supply while an ever expanding money supply should see the gold price drift higher through time. When comparing the run in the gold price to the expansion of the money supply, it appears that the valuation of gold is getting ahead of itself. In prior periods when gold outperformed the money supply to this magnitude (1985 and 2010), the price at some point was ready to take a breather. When assets reach relatively high valuations, as part of our process we apply an expected return premium to help take account for what could be slower future performance. In this instance, while we still think gold makes sense as a hedge against a government mistake, we are beginning to take a more cautious view as the downside of being wrong is increasing.
Chart 4: Gold vs US money supply M2
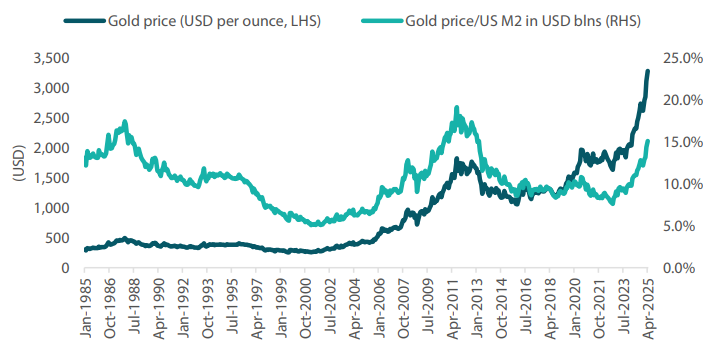
Source: Bloomberg, May 2025
Conviction views on defensive assets
- Increased IG credit allocations : Credit spreads sold off during the April turmoil, which opened up short-dated opportunities. We believe that deals are going to be made on trade and that tax cuts will soon be on their way, which will be supportive of credit spreads.
- Gold reaches expensive valuations : After liking gold as a hedge for the past 18 months, the price has now risen to levels that make valuations look expensive. Versus most asset classes, gold has outperformed and appears expensive against real assets such as housing and other commodities such as copper. While we like the idea of using gold for diversification, we listen to our process and have started to reduce our scores for what appears to be an expensive asset.
- Overweight duration : While we expect the trade deals to be less impactful than the market expectations, central banks do not have this luxury. With the risk of growth slowing, a number of central banks should continue easing, including the ECB, BOE, RBA and the Fed. We like to use Australia as our overweight in duration as among the developed markets it has the largest link to China, and while trade deals could materialise for US allies, China will likely be singled out and face higher tariffs.
Process
In-house research to understand the key drivers of return: