Snapshot
During a month when tariff announcements heavily influenced market movements, the MSCI All Country World Index declined 4.2% in US dollar (USD) terms. The tariff announcements reignited concerns of persistent inflationary pressures and an economic downturn in the US. All eyes are on trade-related developments after the 2 April “Liberation Day” reciprocal tariff announcements—which have sent shockwaves through the global trading system and financial markets. To that end, we believe it is important to stay invested in times of market volatility, as investors can miss out on the market’s strongest days on panic-driven selling, impacting overall long-term investment returns. Across the Atlantic, the European Central Bank (ECB) cut interest rates again to 2.5% from 2.75%, in a nod to slowing inflation and faltering activity. Meanwhile, Germany rewrote its fiscal playbook, which included a EUR 500 billion infrastructure investment fund and changes to its long-standing debt policies to permit higher defence spending. Elsewhere, Chinese stocks continued to gain momentum, fuelled by Beijing's stimulus measures aimed at boosting consumption and supporting the broader economy. Chinese Premier Li Qiang stressed during the annual National People’s Congress meeting that the government’s priority this year was to make “domestic demand the main engine and anchor of economic growth”.
Within fixed income, the month began with some volatility in US Treasury (UST) yields, fuelled by rising global macroeconomic uncertainties tied to trade tensions and geopolitical developments. US President Donald Trump’s inconsistent approach to tariff policies unsettled markets, heightening concerns about inflation and growth. Over in Europe, Germany’s decision to ease its “debt brake” as part of its efforts to revitalise its sluggish economy and increase defence spending added to upward pressure on global bond yields and dampened risk sentiment. Mid-month, the Federal Reserve (Fed) opted to keep interest rates unchanged, citing increased uncertainties around potentially slower growth and higher inflation in the US. Yields rose again following reports that Trump’s planned reciprocal tariffs would likely be more targeted than previously expected. One major “plotline” central to this series of tariff moves is the tense trade relationship between the world’s two largest economies—the US and China. In this issue, we will explore how Chinese bonds have historically offered defensive characteristics and their roles in our portfolios moving forward.
Cross-asset 1
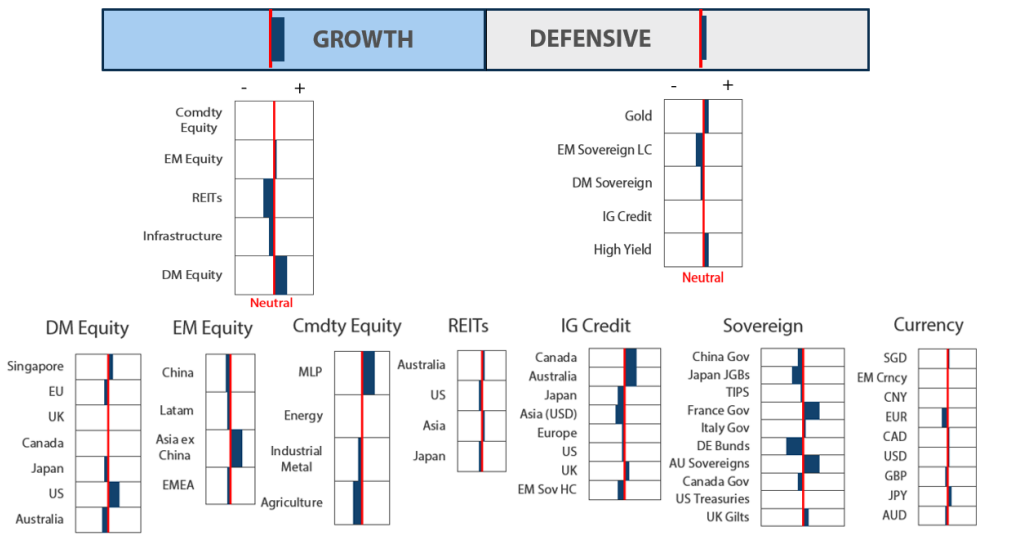
For March, we increased our overweight to growth assets marginally while maintaining our modest overweight position in defensive assets.
Within growth assets, we increased our overweight in developed market (DM) equities and maintained an overweight position in emerging market (EM) equities.
Within DM, we continue to favour the US on the back of better visibility driven by secular growth themes, and we maintained our underweight in Japan. The longer term structural story of improving corporate governance and earnings growth momentum in Japan remains intact, but we maintained our underweight due to the headwinds of yen strength. Instead, we prefer lower beta countries like Singapore for their attractive dividend yields. We maintain our underweight in Europe as we think import tariffs and China weakness could provide headwinds to the region. We reduced the UK to neutral by reallocating to Singapore on relative valuation.
Within EM, we continue to favour selective countries like India which is expected to benefit from domestically-driven economies and structural long-term growth stories. Likewise, we retained our overweight position in Taiwan, which is a beneficiary of the current global tech upcycle.
We maintained our neutral position in commodities. Within commodities, energy was kept at neutral as Trump’s pro-energy policies are expected to benefit the sector via increased volumes.
Our view of defensives is still marginally positive, as the asset class has begun to perform on steeper curves, somewhat slower economic data, rate cuts and policy uncertainty. We reduced our DM sovereign score to a small underweight in March as the valuations are becoming expensive. Likewise, we also moved the IG credit allocations to neutral, reflecting the tight level of spreads which can widen from current levels due to volatility. We moved gold to an overweight, as the asset class should benefit from strong momentum and elevated uncertainties stemming from the Trump administration’s policies. Despite stretched valuations for gold, we believe EM central banks will continue to accumulate the precious metal to diversify their reserves, given that their percentage of forex reserves are still significantly lagging that of their DM counterparts.
Within DM sovereigns, we reduced the allocation to USTs from the previous month given that they had rallied harder, making Australian bonds relatively more attractive. Given that inflation has fallen towards the lower end of the 2–3% target range in Australia, and economic growth has slipped to only 1%, we retain the view that Australia will likely need to ease more than the US. This should be beneficial for Australian bonds and given the steeper yield curves in Australia, the portfolio can gain additional yield from holding the positions.
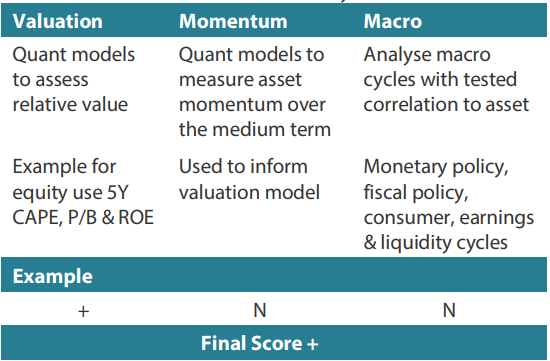
1The Multi Asset team’s cross-asset views are expressed at three different levels: (1) growth versus defensive, (2) cross asset within growth and defensive assets, and (3) relative asset views within each asset class. These levels describe our research and intuition that asset classes behave similarly or disparately in predictable ways, such that cross-asset scoring makes sense and ultimately leads to more deliberate and robust portfolio construction.
Asset Class Hierarchy (Team View 2 )
2The asset classes or sectors mentioned herein are a reflection of the portfolio manager’s current view of the investment strategies taken on behalf of the portfolio managed. The research framework is divided into 3 levels of analysis. The scores presented reflect the team’s view of each asset relative to others in its asset class. Scores within each asset class will average to neutral, with the exception of Commodity. These comments should not be constituted as an investment research or recommendation advice. Any prediction, projection or forecast on sectors, the economy and/or the market trends is not necessarily indicative of their future state or likely performances.
Research views
Growth assets
Growth assets remain appealing as we believe that market valuations look attractive following the recent market correction. Sentiment remains negative as concerns about a global recession have gathered pace in recent weeks. Softening US economic data, coupled with increasing downside risks due to the Trump administration’s unpredictable tariff announcements, is contributing to the uncertainty. However, the pickup in January inflation appears to be transitory rather than entrenched, as February’s reading was lower than market expectations, allaying fears of stagflation.
Global economic data remains soft amid falling inflation, which is likely to prompt global central banks to lower interest rates to support their economies should tariff discussions break down. We expect corporate earnings to hold up well in the coming earnings season, but guidance could be mixed due to the ongoing uncertainty. Earnings growth currently remains on an upward trajectory which is supportive of growth assets, but we anticipate potential earnings adjustments as we move through the quarter.
Staying invested through volatility
Investors have been nervous in the past few weeks due to the pending US import tariff announcements. However, staying invested during market volatility and resisting the temptation to time the market is often considered a wise strategy. Market timing can lead to missed opportunities during rallies and lower returns, as it involves predicting when to buy and sell assets based on market movements. This strategy is risky because it requires accurate predictions, which is a challenge even for experienced investors. Missing out on the best market days can significantly reduce overall returns.
If we examine the past two decades and look at the top ten one-day rallies in the S&P 500, it becomes evident that seven of these rallies happened during bear markets. The recent one-day rally on 10 April is a case in point and now ranks as the third highest in this series (see Chart 1). We believe that staying invested, especially during periods of volatility, can provide better long-term growth and stability.
Chart 1: Ranking of best days (% return) in the S&P 500 for the past two decades
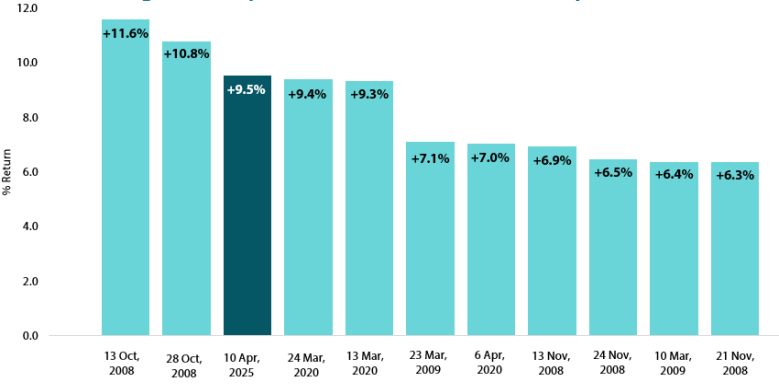
Source: Bloomberg, April 2025
In Chart 2, we assess the potential impacts of missing out on significant one-day rallies. If we had invested from 31 December 2004 to 31 December 2024, starting with an investment of USD 10,000, the value of the invested capital would have amounted to USD 71,543. If we had missed the top 10 best days, the value of the invested capital would have dropped to just USD 32,777, representing a decrease of 54%. Skipping the 40 best days would have resulted in value of the invested capital of USD 9,043 and below the initial investment; missing the top 60 best days would have led to value of the invested capital being 93% lower than the potential USD 71,543 that could have been earned (Chart 2).
Chart 2: The cost of trying to time the S&P 500
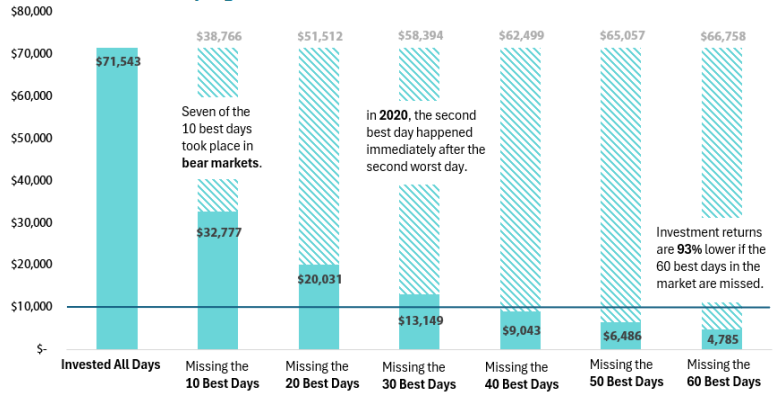
Source: Bloomberg, April 2025
Short-term volatility is common in markets and does not necessarily impact the long-term value of investments. Short-term losses do not erase the market's long-term gains. Staying invested allows for recovery and potential profitability over time, whereas exiting investments during market dips can lead to missing out on recovery periods and exceptionally good market days. Remaining invested allows for the power of compounding to work over time. It also reduces the emotional stress and potential mistakes associated with frequent trading.
Conviction views on growth assets
-
Maintain overweight exposure to US growth for now: Following the recent selloff, we recognise the short-term impact of equity positions on returns, but we also do not want to overreact and sell at valuations that historically have been favourable levels to increase exposure. There remains potential for positive surprises in the market, such as responses from central banks. We see current US market valuations as attractive and are looking for catalysts that could drive further improvements.
-
Overweight on Singapore: We have shifted to an overweight position on Singapore due to its defensive attributes. Singapore offers high dividend yields and low beta. The market is also strong in terms of relative valuation metrics and are least likely to be targeted by Trump’s tariffs policies, given their trade balance deficit position.
-
Maintain modest overweight exposure to EMs: Within EM, we prefer selective markets, such as India, which benefit from domestically driven economies and structural long-term growth stories.
-
Neutral on commodity-linked equities: We continue to believe that commodity-linked equities will keep providing good diversification against inflation in the longer term. The fundamentals of the sector remains compelling due to both cyclical and secular factors.
Defensive assets
Defensive assets continued their rally as inflation inched towards central banks’ targets, supporting the case to stay on the rate-cutting cycle. DM bonds rallied aggressively in early April as the markets priced in more rate cuts amid concerns of a global economic slowdown triggered by the announcement of US tariffs. However, some of the effects were reversed as the tariffs were put on pause. At the heart of the tariff discussions is the strained trade relationship between China and the US, with ripple effects on currencies and interest rates. This month’s Balancing Act looks at the defensive attributes of the Chinese bond market and its role portfolios.
Chinese bonds—how much further?
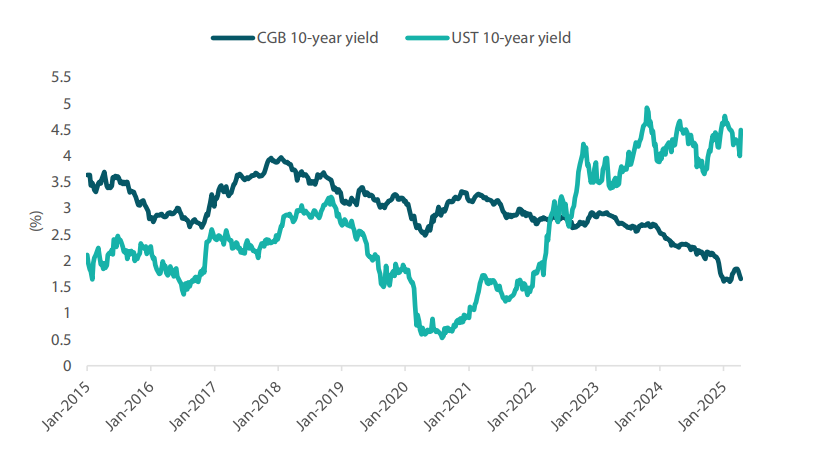
Chinese bonds present an interesting asset class when compared to DM sovereign bonds, as the correlation structure between Chinese government bonds (CGBs) and risk assets differs considerably from that of USTs, German Bunds and Australian government bonds. Part of this divergence can be attributed to the distinct performance of the Chinese economy compared to rest of the world. When inflation spiked in DM economies, China experienced deflation. Even before the trade war intensified, the Chinese economy showed persistent signs of weakness, highlighted by falling home prices, contracting industrial profits and mediocre GDP growth. Consequently, as DM yields rose from 2022 onwards, Chinese yields declined, becoming a more defensive asset relative to other sovereigns.
As Trump now tightens the screws on the Chinese economy with significant tariffs, it is clear that the Chinese authorities will need to provide more support for growth or face an economy that performs well below their targets. The People's Bank of China will likely need to further ease rates in order to boost domestic demand and offset the weakness in the export sector. Historically, this is a signal to go long interest rates and reinforces the appeal of using CGBs as a defensive allocation.
Chart 3: China vs US 10-year yields
Source: Blomberg, April 2025
However, we are beginning to lean away from these allocations and are now favouring defensive positions in countries such as Australia and France. The key concern for a China bond position is that the 10-year yield may not decline much further from current levels. When comparing China to the US, US yields have historically struggled to break below 1%, with breaches really only occurring mainly during the COVID-19 pandemic. And while the outlook for the Chinese economy is challenging, it is increasingly becomingly harder to see the10-year CGB yield declining substantially from the current 1.6% level.
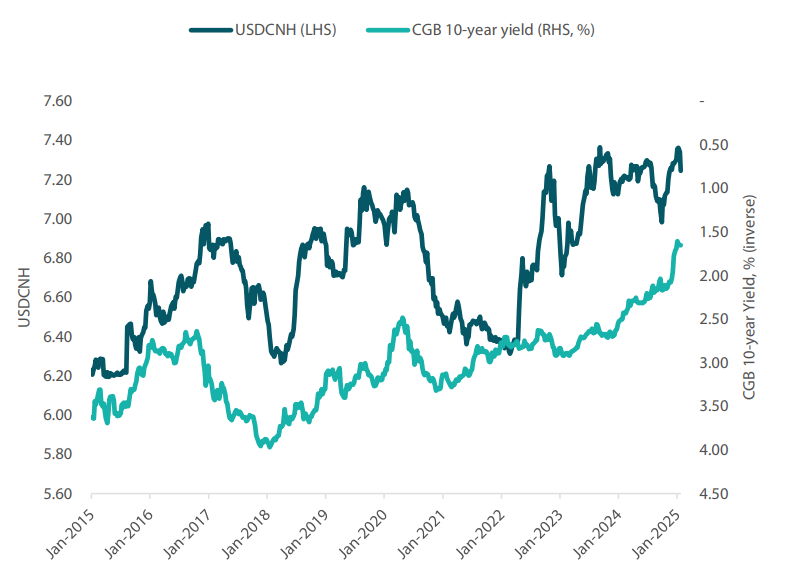
Furthermore, we typically favour unhedged CGBs due to their high correlation with the US dollar, which provides additional negative correlation with risk assets. However, the imposition of higher tariffs increases the likelihood of Beijing devaluing the Chinese yuan to improve competitiveness. While this could potentially provide a marginal boost to yields, it also heightens the risk of currency manipulation, creating a somewhat asymmetric risk profile for portfolios. Accordingly, while CGBs have been a key consideration for a number of years, we look to revise our stance and turn to other sovereign markets instead.
Chart 4: USDCNH vs China 10-year yield
Source: Bloomberg, April 2025
Conviction views on defensive assets
-
Reduced IG credit allocations to neutral: Credit spreads have reached tight levels from which they have historically struggled to contract further. Despite our positive outlook for global growth, we view credit spreads less favourably and shifted our focus towards achieving stable carry in the front end of the bond curve.
-
Gold remains an attractive hedge: Gold has been resilient in the face of rising real yields and a strong dollar, while proving to be an effective hedge against geopolitical risks and persistent inflation pressures. Gold has benefitted from declining real yields, and we use this allocation to supplement our long bond positioning. However, our long term expected return for gold is falling, and this may warrant reconsiderations to allocations in the coming months.
-
Selective on DM sovereigns: After closing long-held underweights in USTs at 4.60%, we now see more value in owing Australian government bonds and French government bonds. These countries offer stronger levels of yield, and Australia, for example, could experience a number of rate cuts over the coming 12 months. With the steepening of the yield curves, we also see value in adding duration in selected DM countries.
Process
In-house research to understand the key drivers of return: