Snapshot
February was a mixed month for asset markets, with equities selling off while bond markets rallied. Global equities turned negative in February with the MSCI World Index dropping 0.81% during the month. It was a mixed performance on a regional basis, as the US S&P 500 fell 1.42% and European markets such as the EuroStoxx rallied by 3.34%. Over the month, European equities performed positively on the prospects of a ceasefire in Ukraine, as US President Donald Trump began to threaten withholding military aid. Elsewhere, the US market reacted negatively to the Republicans' implementation of their policy agenda, as nervousness around tariffs and the newly created Department of Government Efficiency (DOGE) caused business sentiment to drop as disruptions to government employees got underway. In Asia, China put together a strong return, with the Shanghai Composite rising 2.3% in local terms. Chinese technology names performed particularly strongly over the month and sentiment improved substantially.
In the bond market, yields fell substantially over the month, with the 10-year US Treasury (UST) yield dropping 33 basis points (bps) to end the month at 4.21%. The UST market is still coming to grips with the interaction between Republican policy and the shift in US Federal Reserve (Fed) policy, with weaker data in February pushing policy rate expectations lower. US economic data surprised to the downside, as the S&P Services PMI index dropped with respondents citing political uncertainty for their negative view. Outside of the US, other central banks maintained their dovish policy stances, with the Reserve Bank of Australia (RBA) joining the pack of central banks who have moved rates lower. The RBA cut the overnight cash rate for the first time this cycle. In addition, the Reserve Bank of New Zealand eased by 50 bps and the Bank of England implemented a 25 bps rate cut. The European Central Bank also eased in March. The Bank of Japan (BOJ) remains one of the few hawkish central banks. With inflation accelerating in Japan, the market now expects the BOJ to hike rates one or two more times in 2025.
Cross-asset 1
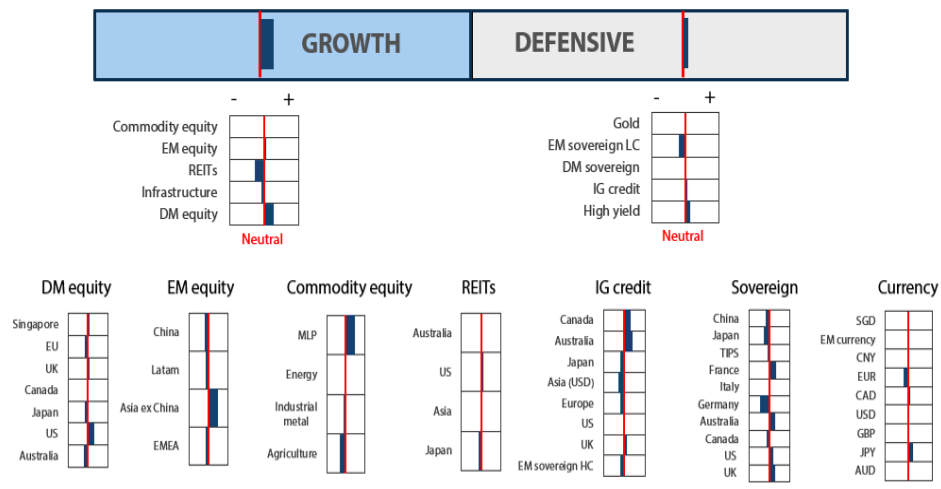
For February, we downgraded our defensive position marginally, while we maintained an overweight to growth assets. With respect to defensive assets, we went overweight on duration back in January to take advantage of the sell-off in yields amid which the US 10-year yield reached a high of 4.70%. As bonds prices have rallied aggressively through February and credit spreads remain tight, we now seek to reduce our duration position marginally although the higher volatility brought into the financial markets as a result of Trump's tariffs usually tends to provide safe-haven bonds with tailwinds. For growth assets, we retained a stable allocation; however, we are looking to increase our exposure to rate-sensitive equities such as infrastructure and utilities in the near-to-mid-term. At the same time, we downgraded our view of Japan equities due to the yen strength.
Within the growth assets, we reduced our overweight in developed market (DM) equities and upgraded to an overweight position on emerging market (EM) equities. Since the start of Trump's announcements on import tariffs, the markets were spooked by the possibility of recession arising. Recent economic data were also weak while inflation remains sticky, resulting in risk-off sentiments that saw global equities retracing from recent highs. However, we still retain our positive view on growth, supported by resilient economic data and dovish monetary policies globally as inflation is now nearing central bank targets. We maintained our overweight in the US on the back of better visibility driven by secular growth themes, and we downgraded Japan to underweight. We continue to like Japan for its longer term structural story of improving corporate governance and earnings growth momentum but reduced our exposure due to the headwinds of yen strength. We remain underweight in Europe as we think import tariffs and China weakness could provide headwinds to the region while retaining our overweight in UK on relative valuation. We maintained our neutral position in commodities. Within commodities, we upgraded energy to neutral as Trump's pro-energy policies are expected to benefit the sector via increased volumes. Within infrastructure, we continue to like US utilities to reflect our positive view on increasing energy demand with the secular growth of data centres. Within EM, we continue to favour selective countries like India which is expected to benefit from domestically-driven economies and structural long-term growth stories. Likewise, we retained our overweight position in Taiwan, which is a beneficiary of the current global tech upcycle.
Our view of defensives is still marginally positive, as the asset class has begun to perform on steeper curves, somewhat slower economic data, rate cuts and policy uncertainty. More recently, we increased our DM sovereign score to neutral, as the hedged yield of owning sovereign bonds has improved substantially over the past three months. We also downgraded our gold score, as the asset class rallied strongly, posting an almost 10% return year to date. Our long-term valuation adjustments are starting to show that gold is expensive, as the returns have far outpaced inflation over the past 12 months. Looking ahead, we see bonds as becoming more defensive again, and we will look to use larger sovereign allocations to replace some of the position in gold that had been held through 2024. While we maintained the investment grade (IG) credit as a whole at marginal overweight, allocations were shifted from US to Australia within the asset class, reflecting the difference in spreads available and hedged yields.
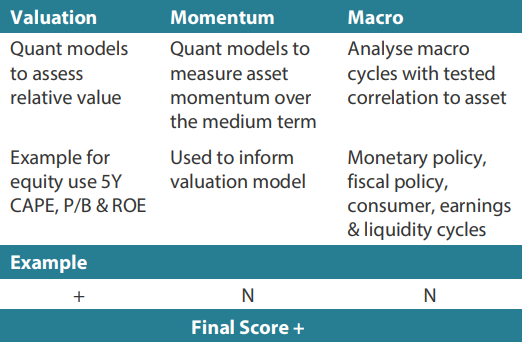
1 The Multi Asset team's cross-asset views are expressed at three different levels: (1) growth versus defensive, (2) cross asset within growth and defensive assets, and (3) relative asset views within each asset class. These levels describe our research and intuition that asset classes behave similarly or disparately in predictable ways, such that cross-asset scoring makes sense and ultimately leads to more deliberate and robust portfolio construction.
Asset Class Hierarchy (Team View 2 )
2 The asset classes or sectors mentioned herein are a reflection of the portfolio manager's current view of the investment strategies taken on behalf of the portfolio managed. The research framework is divided into 3 levels of analysis. The scores presented reflect the team's view of each asset relative to others in its asset class. Scores within each asset class will average to neutral, with the exception of Commodity. These comments should not be constituted as an investment research or recommendation advice. Any prediction, projection or forecast on sectors, the economy and/or the market trends is not necessarily indicative of their future state or likely performances.
Research views
Growth assets
Growth assets remain attractive as we believe that US economic data will remain resilient despite increasing downside risks stemming from ongoing tariff announcements. On the other hand, inflation appears to be stickier than the market expected, increasing concerns about stagflation. Markets retraced from recent highs following the implementation of tariffs on Canada and Mexico, which had been delayed for a month. Markets had expected the earlier tariff announcements to be part of Trump's negotiation tactics and did not expect a further escalation. Meantime, tariffs on China were increased by another 10% to 20%; the US also opted to impose 25% tariffs on steel and aluminium. These decisions were met with disapproval by the markets. Economic data from the rest of the world remains soft amidst falling inflation, which is likely to prompt global central banks to lower interest rates as they shift away from restrictive monetary policies. We believe that corporate earnings will play a key role in our positive view on risk. While tariffs may hurt, corporate earnings should hold up well across most regions. Earnings growth remains on an upward trajectory, which is supportive of growth assets.
Is the glass half full or half empty
Investors have been quite nervous over the past few weeks following the announcement of US import tariffs. The fear of trade escalation, coupled with concerns about a potential recession, weighed on market sentiment as US economic data fell short of expectations. Sentiment deteriorated rapidly after the S&P 500 and Nasdaq reached all-time highs on 19 February. The change in sentiment was rapid, underscored by the breach of technical support levels, with the S&P 500 breaking below the 200-day moving average (see Chart 1). The breach below the 200-day moving average is often seen as a negative signal in technical analysis, suggesting a potential shift from an uptrend to a downtrend. According to Fibonacci retracements, the next support level for the S&P 500 is at 5,550, with a potential downward gap to 5,400 if this level is breached.
Conversely, if we look at the 50-day moving average, it is still trending above the 200-day moving average, which indicates that the uptrend is still intact. However, if the 50-day moving average crosses below the 200-day moving average as a result of a prolonged downtrend, it could indicate a bearish trend called the “Death Cross”. These indicators are worth monitoring over the next few weeks, as the occurrence of a Death Cross in February 2022 coincided with the market declining throughout that year.
Chart 1: S&P 500 Index breaking below its 200-day moving average
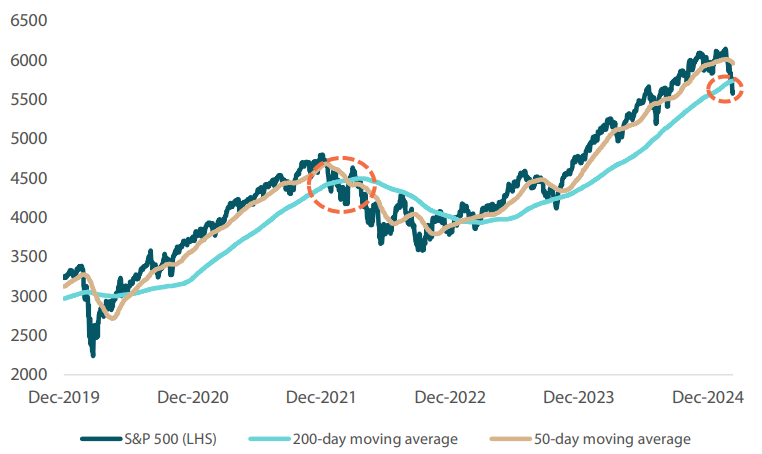
Source: Bloomberg, March 2025
Another indicator that we monitor is the relative strength index (RSI) which is a popular momentum oscillator used in technical analysis to identify overbought or oversold conditions. We can see that the market presently looks oversold (see Chart 2) with the RSI declining to 30. Looking back over the past year, there were three occasions when RSI reached 30, signalling an oversold condition, and in each case the market subsequently rebounded. While we agree that history does not always repeat itself, we believe that it often follows certain rhythms.
Chart 2: Markets typically rebound at oversold conditions (S&P 500 and RSI)
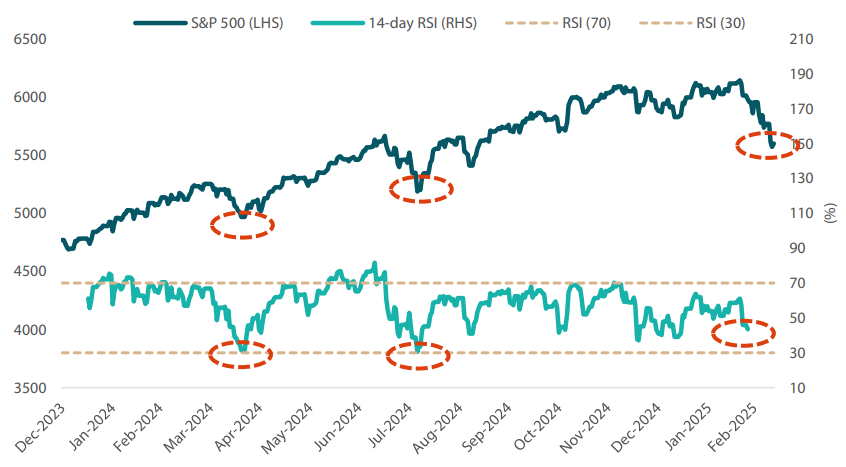
Source: Bloomberg, March 2025
Lastly, when seen from a fundamental point of view, there is an interesting development, especially for Nasdaq. Following the recent correction, the price to earnings (PER) ratio is now trading below the historical five-year mean and moving towards one standard deviation below this historical mean. If company earnings remain stable in the next few quarters despite the weaker economic data and tariff uncertainties, the PER could actually look relatively cheap and this could potentially open up a good entry point.
Chart 3: Valuations starting to look compelling (Nasdaq vs P/E ratio)
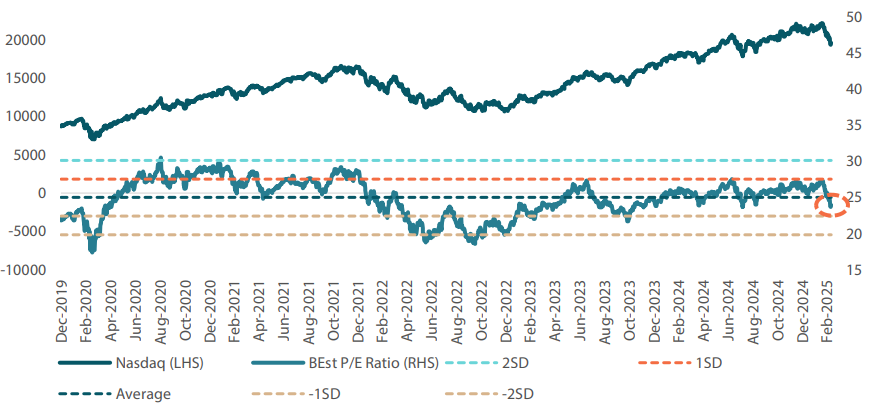
Source: Bloomberg, March 2025
Conviction views on growth assets
- Maintain exposure to US secular growth: We continue to like US tech-related stocks despite market concerns regarding the returns expected on investments made on artificial intelligence (AI) and data centres. Corporate earnings have been holding out well and the secular long-term growth story for the sector remains intact. Within the US, we are also starting to see the rally widening beyond the “Magnificent 7”, which is positive for the overall market.
- Overweight UK and Singapore for defensiveness: We have moved to overweight positions for the UK and Singapore markets for their high dividend yields and low beta. The markets also screen well on relative valuation basis and are least likely to be targeted by Trump's tariffs policy given their trade balance deficit position.
- Upgrade EM to overnight: While we remain of the view that rate cuts will continue into 2025, the pace of the easing will likely slow. A strong US dollar historically would present headwinds for EM performance as central banks in the region will have less leeway to cut rates to stimulate its domestic economy. With the dollar looking close to its peak, we believe a gradual weakening of the currency could provide tailwinds to the region. Within EM, we prefer selective markets which benefit from domestically driven economies and structural long-term growth stories.
- Neutral on commodity-linked equities: Given the weak sentiments, we raised energy equities to neutral by rebalancing the weights from materials. We increased our macro score for master limited partnerships (MLPs) on strong defensive yields and good structural story. We continue to believe that commodity-linked equities will continue to provide good diversification against inflation in the longer term. The fundamentals of the sector remains compelling due to both cyclical and secular factors.
Defensive assets
Defensive assets have maintained their strong start to 2025, with the Bloomberg Global Aggregate Bond Index rallying over 2.6% year to date. With global central banks easing and the rise in political uncertainty with Republicans taking power, we expect defensives to perform relatively well this year. Despite this positive view, not all markets look enticing. Europe is showing that not all may be right in the world of bonds. This month's Balancing Act looks at the large fiscal deficits being run in Europe, and the potential implications on yields should the ECB end its rate cutting cycle earlier than expected.
Budget deficits - funding a war
As the Russia-Ukraine War enters its fourth year, US President Trump has shown his disdain for funding a continued conflict in the region. At a tense meeting on 28 February, Trump argued with the Ukrainian president. Trump claimed that his Ukrainian counterpart did not want peace and subsequently suspended military aid to Kyiv. European countries saw the significance of the situation and are now scrambling to increase their defence spending in order to establish stronger security. Notably, this has seen plans from the European Union to increase defence spending by up to euro (EUR) 800 billion, as the European Commission seeks for countries to spend an average of 1.5% of GDP on defence. While this may help make Europe more secure, it raises questions of fiscal sustainability from a bond perspective, as most European countries are already running large budget deficits. For example, even fiscally conservative Germany is running a budget deficit of 2.6% of GDP, while France is at 6%, Italy at 5% and the UK at 5%. These budget deficit levels are typically associated with recessionary periods, and when most European countries already have debt-to-GDP ratios exceeding 100%, it brings into question whether the spending is sustainable.
Chart 4: European budget deficits
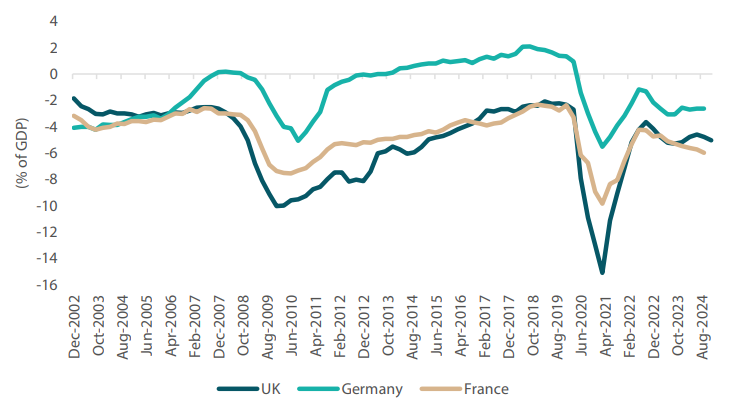
Source: Blomberg, February 2025
The bond market's first reaction to this news was negative, with German Bunds experiencing its worst one-day sell off since the early 1990s. While such a reaction may seem extreme, it is not unusual for bond yields to bounce aggressively higher when reaching the terminal cash rate of the interest rate cycle. One of the big changes that this increased defence spending will bring is not just larger fiscal deficits, but also a higher likelihood of the ECB ending their rate cutting cycle sooner than the market previously expected. As chart 5 below shows, the higher fiscal spending has seen the market reprice the odds of the ECB cutting, with market expectations for the policy rate in 12 months' time rising from a low of around 1.80% to 2.20%. If this new pricing is correct, it suggests that the ECB may only cut rates two or three more times, bringing the end of the easing cycle into sight.
Chart 5: German interest rate structure
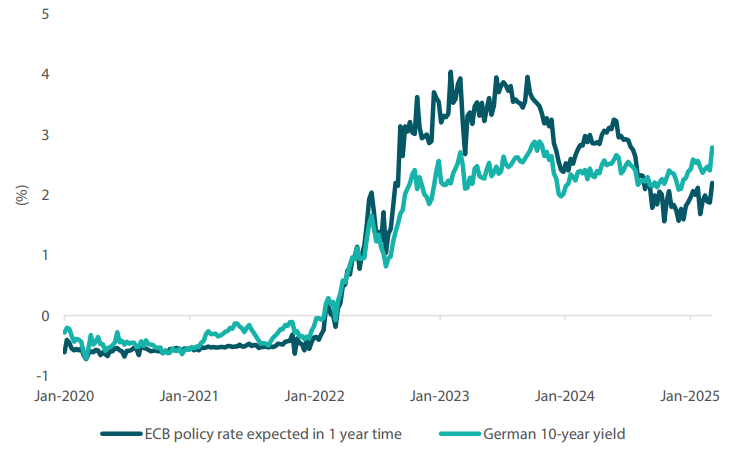
Source: Bloomberg, Nikko AM, February 2025
From a “fair-value” perspective, we typically view the policy rate plus 100 bps as a fair value for long-dated bond markets. With respect to Germany, should the ECB end their cutting cycle at 2.25%, this would put a fair value for bond yields in the 3.0% to 3.25% range. We have long been underweight Bunds on the notion that the market being perceived as expensive relative to the policy rate, and this recent sell-off now takes the market closer to fair value. The long-term implications of Europe defending itself are yet to be seen; however, the short-term implication is that bond yields will likely remain higher for longer as the market digests these greater levels of spending.
Conviction views on defensive assets
- Defensive IG credit allocations: Credit spreads are hitting tight levels that they have historically struggled to contract through. Despite our positive outlook for global growth, we have begun to reduce our exposure to credit spreads and focus on achieving stable carry in the front end of the bond curve.
- Gold remains an attractive hedge: Gold has been resilient in the face of rising real yields and a strong dollar, while proving to be an effective hedge against geopolitical risks and persistent inflation pressures. Falling real yields have benefitted the asset class, and we use this allocation to supplement our long bond positioning. However, our long term expected return for gold is falling, and this may warrant reconsiderations to allocations in the coming months.
- Focus on Australian, French government bonds: Although central bank easing cycles are likely to end sooner than expected, the global curve steepening makes bonds look more attractive. After closing long-held underweights in USTs at 4.60%, we now see more value in owing Australian government bonds and French government bonds. These countries offer stronger levels of yield, and Australia, for example, could experience a number of rate cuts over the coming 12 months.
Process
In-house research to understand the key drivers of return: