Snapshot
The outlook is increasingly clouded as markets come to terms with a US Federal Reserve (Fed) that may do “whatever it takes” to contain inflation. Given that current inflationary pressures appear to be mainly driven by supply-side constraints and rising energy prices, it follows that the Fed would need to be willing to take the economy into a recession to meet its mandate. Even still, markets may have overpriced this possibility given that financial conditions have already tightened significantly without much help yet from Fed policy. Annual inflation has also likely peaked and is set to challenge the rampant inflation narrative that has become well-entrenched this year.
While central bank hawkishness may be the chief driver of negative market sentiment for risk assets, China’s adherence to “zero tolerance” on COVID-19 risks and a grinding proxy war between NATO and Russia also present potentially formidable headwinds to prospective global growth. So far, demand has held up reasonably well, partly supported by consumers still aiming to release (post-COVID) pent-up demand. But the months ahead will be important for assessing the health of the economy, considering that the impact of these headwinds are still not well understood.
Importantly, and different than last month, markets have moved a long way in response to expectations for central bank policy in the face of high inflation. Overreactions have always been a feature of markets and so some relief from recent falls may be around the corner should upcoming data or events surprise with more moderate outcomes.
Cross-asset 1
We downgraded our view on growth assets this month from neutral to negative as we worry about a potential deterioration of global demand conditions. At the same time, our negative view on defensive assets remains. For the moment, policymakers are plotting a course to tame inflation pressures that could come at the expense of sacrificing demand, with the Fed tightening to quell price pressures and China sticking to its “zero tolerance” policies for beating COVID-19. Tight US monetary policy and weak China demand is a bad recipe for global demand, but just as we were sceptical of the strong rally last month, the current fear driving markets down significantly may also be overdone. Still, it could take time for the narrative to take a more benign shift, so we remain defensive.
We reduced our more positive view on Emerging Market (EM) equities to match our cautious stance on Developed Market (DM) equities, preferring both REITs and listed Infrastructure instead, as they tend to be less sensitive to the economic cycle. On the defensive side, we reduced high yield credit—which naturally has higher beta to risk assets—as well as EM debt and gold. We added to DM sovereign bonds and, to a lesser extent, investment grade credit as higher yields begin to look attractive. Longer duration yields could be poised for some retracement from recent highs due to either increasing recessionary fears or the Fed sounding marginally less hawkish as base effects begin to reverse in the second quarter, leading to lower annual inflation outcomes in the months ahead.
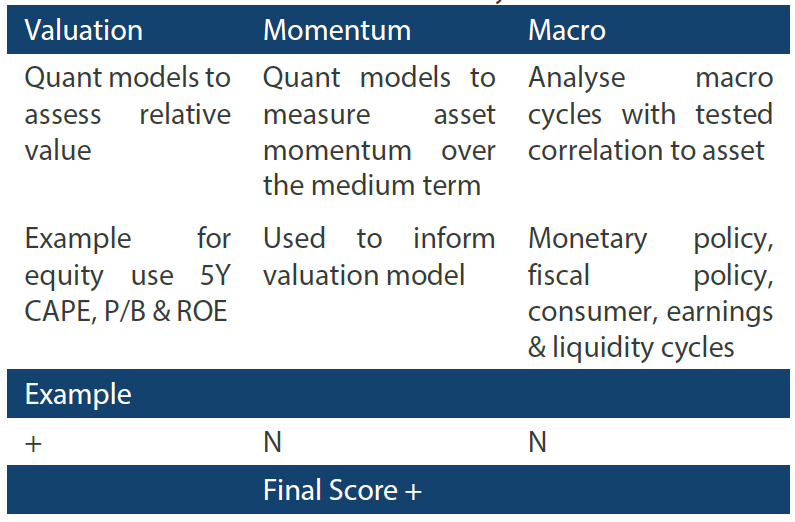
1 The Multi Asset team’s cross-asset views are expressed at three different levels: (1) growth versus defensive, (2) cross asset within growth and defensive assets, and (3) relative asset views within each asset class. These levels describe our research and intuition that asset classes behave similarly or disparately in predictable ways, such that cross-asset scoring makes sense and ultimately leads to more deliberate and robust portfolio construction.
Asset Class Hierarchy (Team View2)
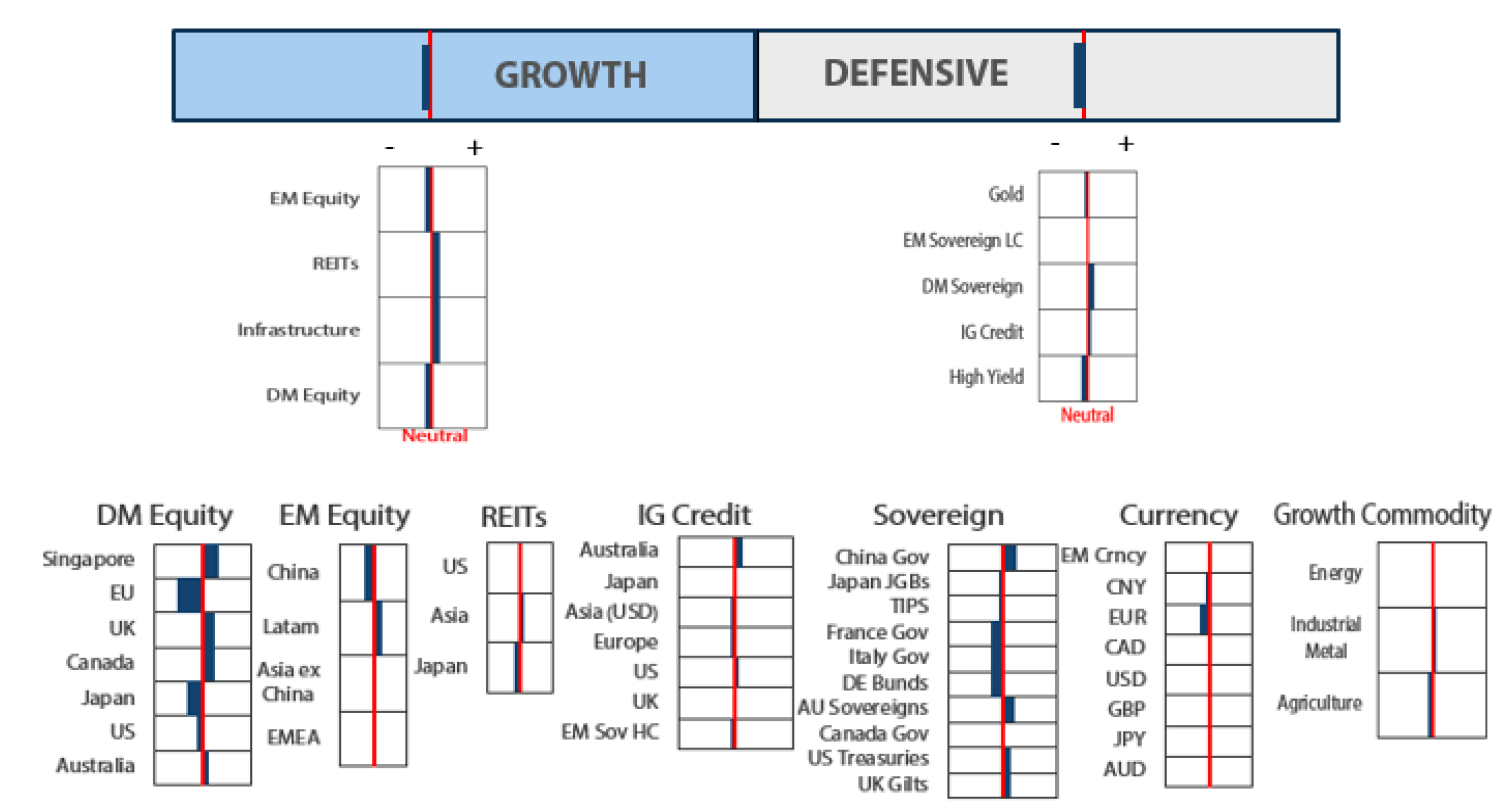
2 The asset classes or sectors mentioned herein are a reflection of the portfolio manager’s current view of the investment strategies taken on behalf of the portfolio managed. The research framework is divided into 3 levels of analysis. The scores presented reflect the team’s view of each asset relative to others in its asset class. Scores within each asset class will average to neutral, with the exception of Commodity. These comments should not be constituted as an investment research or recommendation advice. Any prediction, projection or forecast on sectors, the economy and/or the market trends is not necessarily indicative of their future state or likely performances.
Research views
Growth assets
While recessionary (or even “stagflationary”) fears are clearly on the rise as growth is indeed slowing and policymakers remain quite hawkish (the Fed on monetary policy and China on zero tolerance), but these increasingly negative outcomes are far from certain and any easing concerns at the margin could offer relief and support for risk assets.
The Fed is hawkish for good reason as inflation is spreading well beyond the supply chain dislocations caused by the pandemic. On its face, Fed policy is driven by setting levels of rates and degrees of quantitative easing or tightening by changing the size of its balance sheet, but the transmission mechanism is ultimately driven by changing financial conditions, which are currently very tight and should slow demand. In effect, while the Fed has barely raised rates and has yet to reduce its balance sheet, it has effectively tightened policy quite significantly.
At the same time, a “soft landing” (avoiding a recession) is not off the table for what the Fed is hoping to achieve, but this is difficult to credibly accomplish while headline inflation data remains so high. The Fed is well aware that base effects are likely to ease some of the pressures of headline inflation, and it also knows that these headline numbers do not mean much in terms of describing real inflationary pressures.
But these figures do drive sentiment so if these figures ease at the margin as we think they will, the Fed can stay hawkish but without an increasing sense of urgency to “tighten even more”—which necessarily takes the economy into recession. In other words, we could see some relief at the margin where sentiment has grown to be nearly universally so negative.
We see a similar backdrop for China, which is adhering to the seemingly dubious policy of zero tolerance for COVID-19. No matter the long-term sustainability of such policies, they can work over the short term as they appear to be now, allowing Shanghai and other locations to ease restrictions. However, the virus continues to spread to other parts of China, prompting further lockdowns, but policymakers are also eager to show signs of success and to support economic growth hit by a tight property market, declining export growth and—of course—a serious economic slowdown due to lockdowns. This is to say that sentiment is quite negative for good reason, but some relief at the margin allowing economic activity to pick up could lend a degree of support for risk assets.
Are stocks nearing fair value?
The S&P 500 is down around -15% from its highs, so it is an apt and necessary question to ask whether stocks are nearing fair value to consider re-entering exposures in a broader market that may be driven too much by fear, thereby causing stocks to go “on sale”.
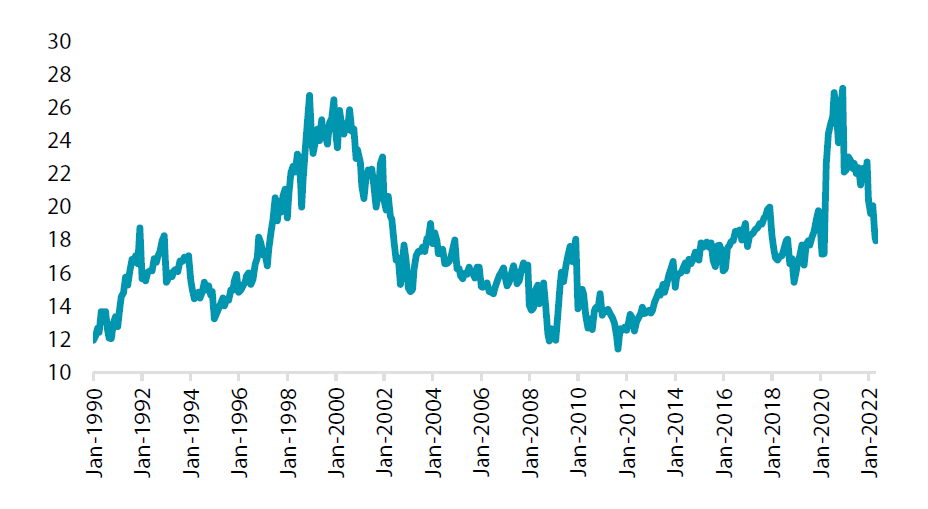
At the end of the day, equity prices are driven by earnings and valuations, the latter of which have corrected quite significantly since early in the year, currently at 18x, down from 27x as measured by the price to 12-month forward earnings (Forward PE), which is close to the 17.3x average back in 1990 and around where valuations stood pre-pandemic.
Chart 1: S&P 500 forward PE Ratio (Best P/E Ratio)
Source: Bloomberg, May 2022
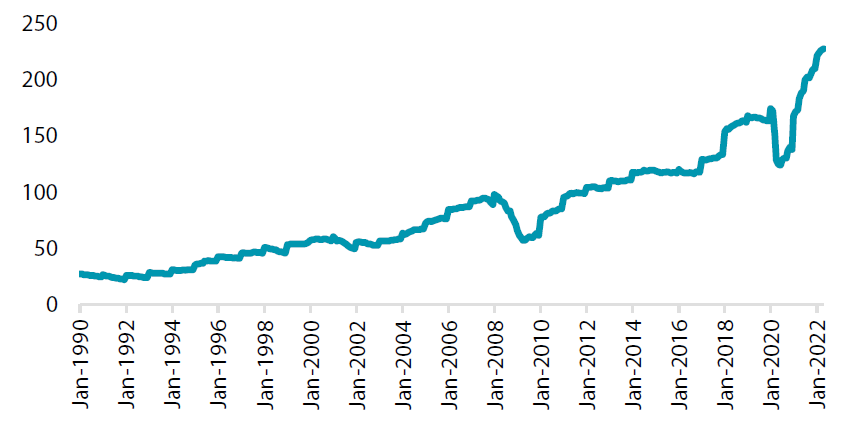
There is no question that US equities are much more attractive at current levels, but the negative sentiment holding down equities at the moment is the question of future earnings. S&P forward earnings per share is US dollar (USD) 227, up a remarkable +80% from the depths of the pandemic and still a very respectable +30% versus pre-pandemic. Over the long term, earnings naturally grow along with the economy, subject to mean reversion based on placement in the economic cycle.
Chart 2: S&P 500 forward earnings (Best EPS)
Source: Bloomberg, May 2022
Just visually, recent earnings growth since the pandemic look outsized, and our concern is that some of this excess earnings growth may be attributable to the massive stimulus which is currently being withdrawn, and the rotation from services to goods during the pandemic, which is now normalising to pre-pandemic normal patterns of demand.
Earnings growth from 1990 through the end of 2019 is a healthy 6.12%, annualised. Assuming this represents “normal” earnings growth and if one extrapolates this growth rate out to the end of 2021, earnings per share would have stood at about USD 188 which is about 17% below the current level of USD 227. If earnings do, in fact, mean revert to USD 188 while maintaining the current price, PE jumps to 21.7x, which again starts to look rich relative to history.
Of course, if the US enters a recession, earnings could overshoot their adjustment to the downside, which is why the state of the economic cycle is so important. Our base case is that the recovery remains intact, but there are a multitude of risks to this proposition, given the Fed’s determination to take down inflation while China seems equally determined to stick with its zero tolerance policies, which are both negative for the global growth outlook.
The degree of negative sentiment baked into the market is at least partly driven by fears of an impending recession. As such, should inflation data ease at the margin, policymakers may back off from their extremely tough rhetoric to date—just enough to allow negative sentiment to ease while avoiding overly tight policy that otherwise assures a recession. Our view is that inflation data will start to ease at the margin, purely for rolling base effects but enough to avoid a sense of urgency that a recession is necessary to take down inflation.
Nevertheless, we are still concerned that earnings growth may continue to mean-revert as policy is unlikely to return to an accommodative stance any time soon, and demand continues to shift away from goods back to services. Our “pure value” (a value-tilted subset of the S&P 500) exposure is currently valued at 11.5x, about a 35% discount to the S&P 500 while showing normal earnings growth that are less subject to mean-reversion. We expect the rotation from growth to value to continue.
Conviction views on growth assets
- Near-term relief: Inflation may lose momentum with the impending base effects likely to trim the headline number. This perhaps mitigates the worst fears of a recession or stagflation to offer a degree of stability in rates and risk appetite. Fears of a China slowdown may also ease at the margin as a function of zero tolerance policies which, while not ideal, are showing a degree of success allowing lockdowns to ease while policymakers remain committed to stimulating the economy.
- Favour commodity-linked equities, still: Commodities and asset prices linked to them (equities and currencies) have been under pressure of late, mainly driven by fears of a China slowdown due to its zero tolerance policies, which could benefit some as lockdown pressures ease. Valuations are compelling, earnings are strong and supply-side pressures remain intact.
- Long-term structural headwinds: To be clear, we still believe the global economy will need to adjust to structurally higher inflation as a function of commodity price pressures and deglobalisation that continues. This will take time, and we expect volatility to remain elevated for some time as the adjustment continues.
Defensive assets
After a lengthy period of being negative on sovereign bonds, we upgraded our view to positive this month. Expectations of central bank monetary policy tightening have shifted significantly this year. Indeed, inflation has surged in many countries, but we believe that the peak is now approaching, and longer-term inflation expectations are well behaved. Employment has had a strong recovery but participation and productivity rates still have room to improve, helping to contain pressure on wages. Central bank pricing has now become too front loaded in our view, creating tactical opportunities in sovereign bonds over the coming months.
We also upgraded our view on investment grade credit to positive. While spreads have established a widening trend this year, it has largely been a move driven by sentiment as credit fundamentals remain quite strong. The greater damage to returns has been from rising global rates. On this front, we expect that investor bearishness on rates may be set to peak in the near term as markets have already priced in a substantial tightening of central bank policy. As a result, a more constructive climate for rates may greatly reduce the duration risk in the sector. However, we have downgraded our view on high yield credit to negative, as risk appetite is expected to remain more cautious. This also
Gold has had a great run this year but is becoming very stretched relative to higher real yields and strength in the US dollar index. Hawkish central banks and declining real wages are fuelling global growth concerns which could eventually become self-fulfilling, leading us to prefer sovereign bonds over gold. As a result, we have downgraded our view to mildly negative.
Seeking redemption in fixed income
Fixed income markets have been, to say the least, disappointing for investors so far in 2022. They have failed to provide positive returns befitting an income-style investment and have failed to provide a positive offset to falling equities markets. Asset allocators have become accustomed to nice, stable returns from US Treasuries over the last 30 years, with only five negative years and no back-to-back losing years over that period. Last year was one of those negative years and we now find ourselves with a strong chance of breaking that run with consecutive losses in 2021 and 2022.
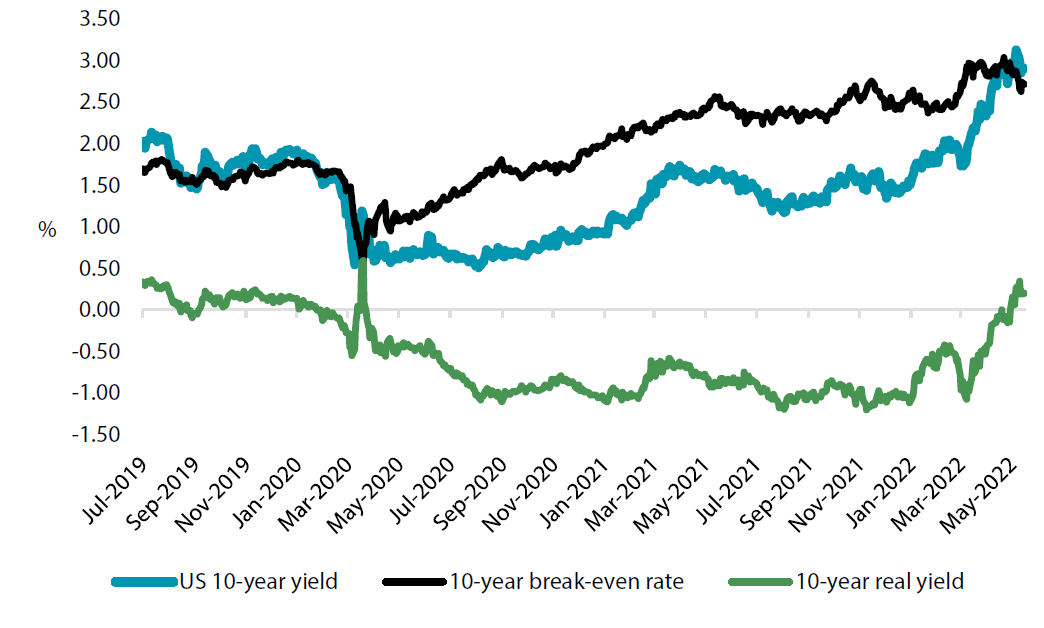
Chart 3: 10-year US Treasuries yields
Source: Bloomberg, May 2022
It has only been a few months since investors were contemplating whether US 10-year yields could sustain a break of 2% and the thought of positive real yields seemed a bridge too far. However, the changes have been swift as shown in Chart 3. The questions for today are whether 10-year yields can remain at about 3% and whether real yields can stay positive. Compared to pre-pandemic levels, nominal yields are now higher and real yields have completed a round trip back to positive.
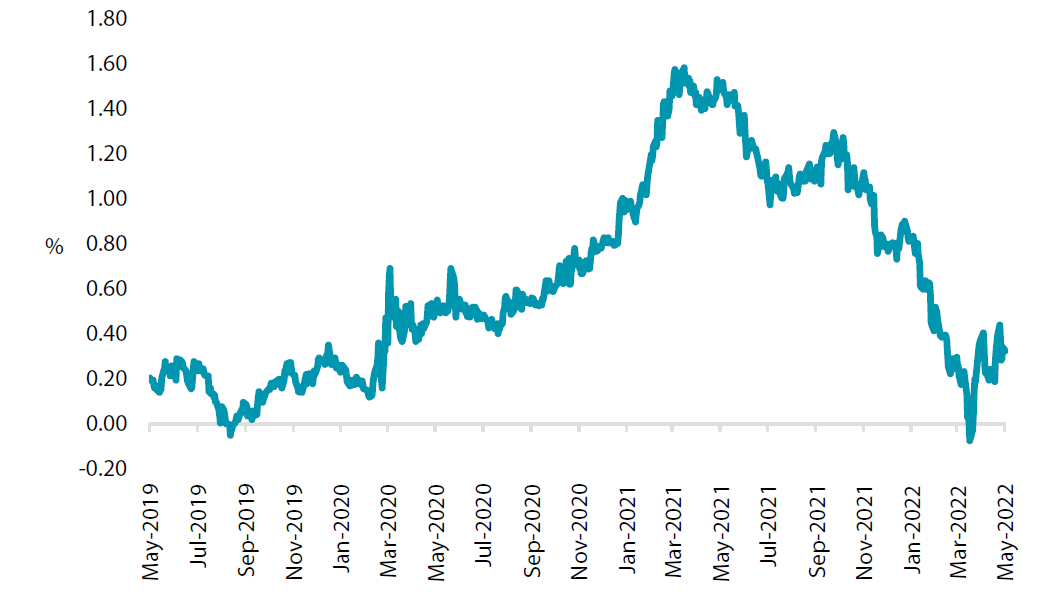
Chart 4: US Treasuries yield spread (10-year minus 2-year)
Source: Bloomberg, May 2022
While the broader market tends to focus on the level of interest rates, the US yield curve has also experienced some large moves. Chart 4 shows the spread between 10-year and 2-year US treasuries yields over the pandemic period. The yield curve steepened sharply as the Fed provided monetary policy by dropping cash rates to near-zero, but it has also returned to pre-pandemic levels after a very brief inversion. All of nominal yields, real yields and the yield curve have now unwound the pandemic-induced moves.
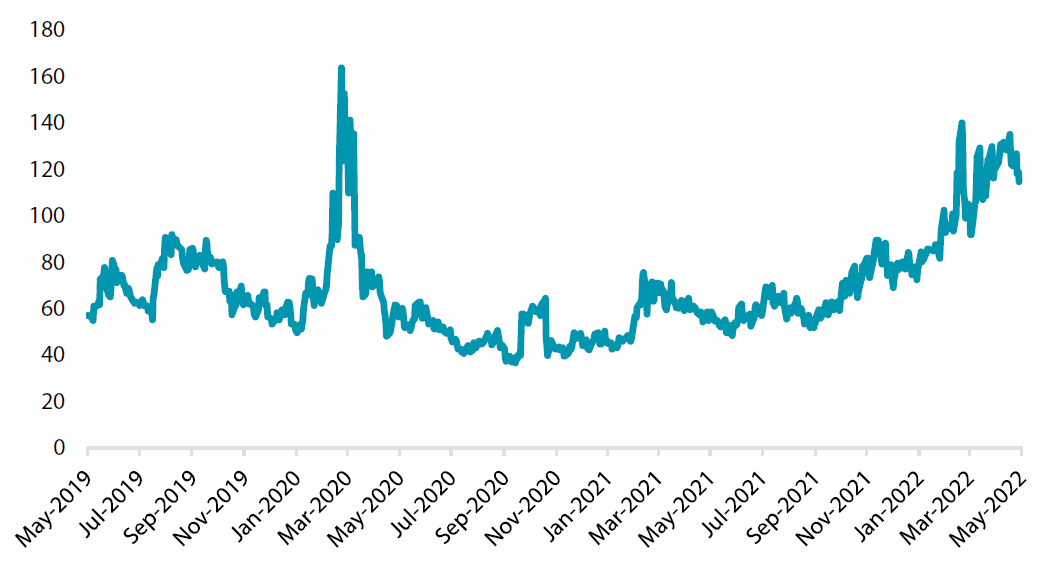
Chart 5: ICE BofA MOVE index
Source: Bloomberg, May 2022
There is, however, one US bond market indicator that has yet to follow these retracements. Chart 5 shows an indicator of volatility in bond markets, the MOVE index, which is similar to the VIX indicator used for equity markets. US Treasuries volatility has indeed been high by historical standards and has only very recently started to recede. While in our view, US Treasury yields are now presenting opportunities for redemption as inflation pressures begin to peak and the market-implied path for rate hikes looks overly aggressive, other investors may be waiting for volatility to subside further before increasing bond allocations.
Conviction views on defensive assets
- Add duration to dollar-bloc and UK bonds: The surge in CPI measures has been significant but also flattered by base effects which are due to unwind in the quarter ahead. We view the current market expectations for rate hikes as overly aggressive, which presents opportunities to add duration risk.
- Hedge the Chinese yuan: China faces increasing growth headwinds including declining export demand and capital outflows from weak equity markets. China’s government bonds have also lost their yield advantage relative to USTs. The Chinese yuan is expensive relative to trade partners, and China’s policymakers may allow its currency to weaken to help mitigate slowing demand.
Process
In-house research to understand the key drivers of return:
