Snapshot
Volatility has arisen as we expected it eventually would, and September is often an apt month to rediscover risk given market participants’ return from summer vacations noting that record high equity markets do not quite square with a number of significant risk events on the near-term horizon. Some events were to be expected, such as the US Federal Reserve (Fed)’s plans for an eventual taper, debt ceiling stress emanating from Washington and slowing growth due to the spread of the COVID-19 Delta variant. But the almost synchronised world-wide energy crunch came as slightly more of a surprise.
We believe the pullback in equities will prove to be a healthy correction from an otherwise relentless rally in US equities since November 2020. While markets are mostly forward looking, sometimes they need to catch up to a more balanced perspective on risk—and often, in the process, they will overshoot to the downside of getting too bearish. Markets are far from being overly bearish, but risk is more balanced, and we see encouraging signs ahead.
The spread of the Delta variant is past its peak, particularly in the West but also with encouraging signs in Asia. As mobility improves through the gradual lifting of restrictions, demand will also improve. While the Fed begins to gradually remove its extraordinary easing measures, policy will remain easy for some time, allowing the recovery to continue and likely gather pace.
Energy price pressures do present near term challenges but are unlikely to require any change in monetary policy. Governments might have been overzealous in their aggressive actions to direct capital away from fossil fuels, which is partly driving the various shortages, but solutions do exist to better balance supply with demand while still meeting long-term objectives for net zero emissions.
We remain constructive on the recovery, but cautious for potential negative surprises. We still believe most inflationary pressures will prove transitory, although we will watch the data closely for signs it could be stickier than anticipated. Also, China demand has weakened at the margin and while we expect policy to ease, the regulatory crackdown and repercussions of a tight property sector are important developments to monitor.
Cross-asset1
We marginally increased our view on growth to be moderately positive on the premise that risk is more balanced given the correction, and economic prospects are recovering with the latest COVID-19 wave fading. We also further downgraded our negative view on defensive assets, given the Fed’s impending taper that is likely to lift yields further through the execution phase.
Within our growth and defensive sleeves, we made several adjustments to our classifications to better capture shared characteristics. High Yield (HY) and Emerging Market (EM) bonds were shifted from growth to defensive for shared duration characteristics while EM Hard Currency (HC) was moved to Investment Grade (IG) where spreads are appropriately compared.
Through this lens, we lifted HY to neutral and maintain a neutral view with respect to EM Local Currency (LC) bonds, both below our more favourable view on sovereigns and IG. We also further downgraded our negative view on gold given upward pressures on real yields. Within growth assets, we are still neutral on both DM and EM equities, favouring REITs as part of the re-opening play, balanced by a small underweight to infrastructure.
1The Multi Asset team’s cross-asset views are expressed at three different levels: (1) growth versus defensive, (2) cross asset within growth and defensive assets, and (3) relative asset views within each asset class. These levels describe our research and intuition that asset classes behave similarly or disparately in predictable ways, such that cross-asset scoring makes sense and ultimately leads to more deliberate and robust portfolio construction.
Asset Class Hierarchy (Team View1)
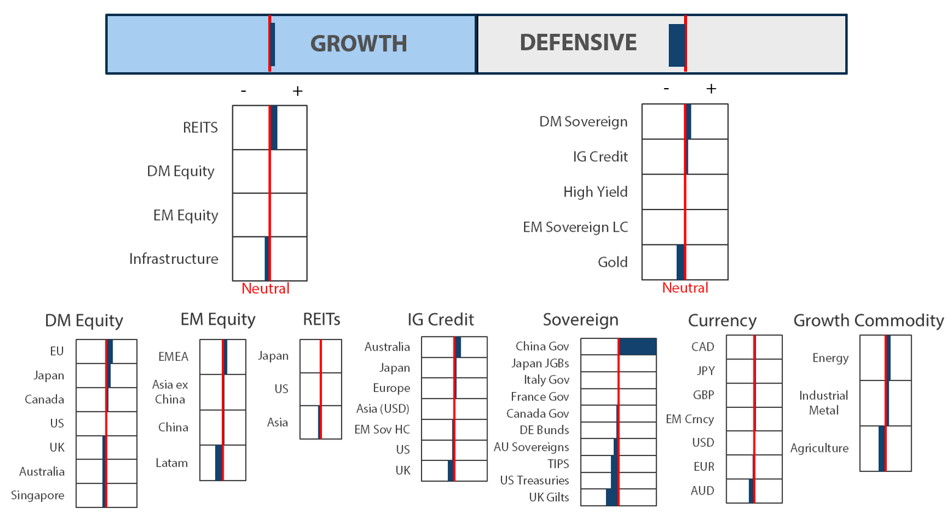
1The asset classes or sectors mentioned herein are a reflection of the portfolio manager’s current view of the investment strategies taken on behalf of the portfolio managed. The research framework is divided into 3 levels of analysis. The scores presented reflect the team’s view of each asset relative to others in its asset class. Scores within each asset class will average to neutral, with the exception of Commodity. These comments should not be constituted as an investment research or recommendation advice. Any prediction, projection or forecast on sectors, the economy and/or the market trends is not necessarily indicative of their future state or likely performances.
Research views
Growth assets
Markets are generally efficient, balancing opportunity against risk, but not always—driven by market participant greed and fear. Starting in September, sentiment shifted from greed to fear, and while this shift may have run its course, judging changes in sentiment is tricky, particularly when narratives shift to justify a natural tendency to retain yesterday’s view.
Markets are far from reaching deeply negative sentiment, but the narrative is shifting. In September, a combination of rising COVID-19 cases, slowing growth, the Fed’s plans to taper and the debt ceiling gave good reason for concern, but these event risks have for the most part passed. Markets are now focusing on inflation, which is now exacerbated by energy shortages spreading around the world. Is inflation sticky, not transitory? Even worse, are we approaching a stagflation scenario, where low growth coupled with high inflation depresses both bonds and equities?
We take stagflation risk very seriously as it would have negative implications for capital markets in general and, as asset allocators, would require significant changes to our allocation mix. Our current assessment is that stagflation is a very low probability event, particularly over the near term, but there are key developments to follow.
The policy stagflation conundrum
Stagflation is a relatively rare condition of high inflation coupled with low growth that over the last century was mostly experienced during the period from late 1960s through the 1970s. The period began with easy monetary and fiscal policy that ran the economy too hot, lifting demand and prices. This subsequently led to deep monetary tightening that caused a long period of adjustment with slow growth and high inflation until inflation was finally brought to heel by the early 1980s.
The set-up to stagflation sounds familiar—very easy monetary and fiscal policy—but this is where the comparison more or less ends because the economy has yet to run hot as demand is still in the recovery phase. As is well known, this time inflationary pressures have been driven by supply, not demand. This is an important distinction because the Fed only controls the demand side. If the Fed were to raise rates to lower demand, this would be a policy mistake given that demand is still recovering.
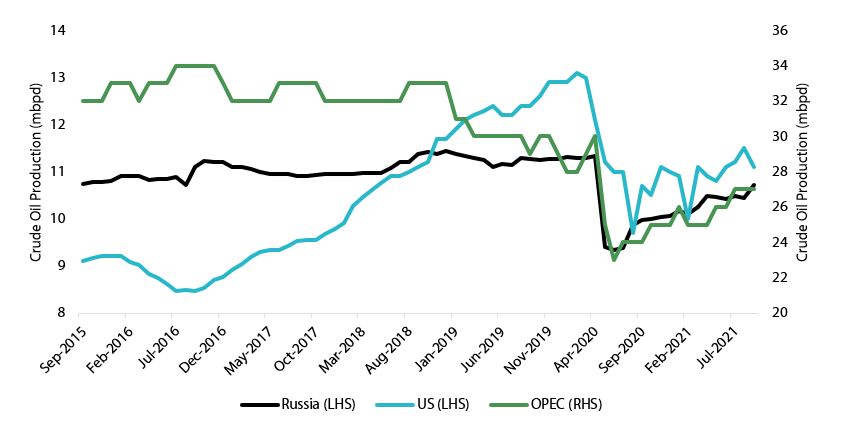
So, who controls supply? Ordinarily, capital. When demand exceeds supply, driving prices up, capital is deployed to build more capacity which over time keeps supply and demand in balance. Today, COVID-19-driven supply chain disruptions are limiting the delivery of supply, but government policies are also steering capital away from fossil fuels toward green energy replacements. While this is an objective everyone wants to achieve, there are price consequences over the near term. As shown in Chart 1, while the US ramped shale oil production up until 2020 to keep oil prices low, new policies make it difficult for shale to fill the supply gap, lifting prices higher.
Chart 1: Crude oil production - US versus OPEC and Russia
 Source: Bloomberg, October 2021
The Biden administration is now asking OPEC+ to increase production to ease price pressures, but this is in itself an admission that it will take time to navigate to a zero emissions objective. We suspect governments will ultimately have to adjust policy to a more pragmatic course for reaching long-term objectives.
If policies fail to adjust and shortages and high prices continue, there is indeed a risk of demand destruction that resembles stagflation. But unlike the 60s and 70s that started with an inflationary boom that turned to a bust of stagflation, this version will be driven by policy that could lead straight to an inflationary bust.
We still believe this is a very low probability event. The Fed does not have to tighten policy to cool the economy because it is not yet hot and tightening will not cure the problem because demand has yet to fully recover. This should allow growth to continue as other government policymakers fine-tune their policies toward a sustainable future. Of course, we monitor this risk however remote.
Conviction views on growth assets
- Tilt toward value: As growth improves, recovering from the latest Delta-driven wave, mobility is returning. This environment favours cyclicals over growth—particularly if long-term rates continue their ascent, which we believe they will.
- Favour Europe: We favour Europe for its cyclical characteristics that benefit from returning growth as the latest COVID-19 wave continues to ebb, and we believe the region should prove more resilient in a rising rate environment.
- Favour Japan: Despite the recent sell-off in Japan apparently sparked by potential tax hikes by the new prime minister, we still see opportunities for attractive valuations and a firmly weak yen. Higher taxes are never appreciated, but they rarely have a long-term negative impact on equity markets.
Defensive assets
We have downgraded our already cautious view of defensive assets. While two smaller central banks, the Reserve Bank of Australia and the Bank of Canada, have begun tapering their asset purchases, the two largest, the Fed and European Central Bank, continue to drag out their support for quantitative easing (QE). The bifurcation amongst developed economies between those with core inflation that exceed their targets and others that are still faced with low inflation is likely to result in an unsynchronised withdrawal of monetary stimulus. However, the US is firmly in the former camp and we expect the Fed to begin tapering soon with both core inflation and employment having made “significant progress” towards its objectives.
We maintained our constructive view on global credit relative to sovereign bonds. Rich valuations for both IG and HY bonds are presenting modest headwinds but momentum continues to be positive across credit markets. Investor interest in corporate bonds is still strong as the global recovery continues to support improving credit quality. However, spread compensation for credit risk is at very low levels historically which will make further spread contraction difficult. As a result, we expect credit spreads to remain in tight ranges with limited opportunities for further tightening.
Headwinds are growing stronger for gold prices as the threat from the Delta variant is beginning to retreat, and global growth prospects continue to improve. These factors also point to the Fed moving closer to tapering its asset purchases, which we expect to lead to higher real rates. This shift in real rates, combined with stronger growth in the US relative to the rest of the world, should also lend support to a stronger US dollar.
Quantitative easing and intended consequences
Prior to the great financial crisis (GFC), the Fed’s primary policy tool was the setting of official overnight cash rates which anchors the yield curve and impacts borrowing rates across the economy. However, the significant threat to the financial system that was triggered by the failure of Lehman Brothers in September 2008 led the Fed to expand its toolkit of “unconventional” policy measures. Borrowing from the Bank of Japan’s playbook, the Fed initiated a QE programme for the first time in March 2009. Roll forward ten years and large-scale asset purchases have become a conventional monetary policy response to serious economic disruptions.
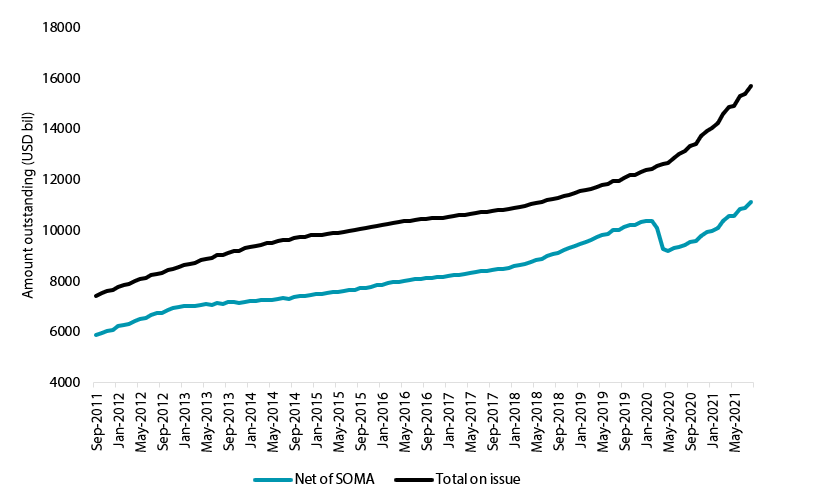
The Fed’s current QE programme in response to the pandemic involves the monthly purchase of USD 120 billion in securities, consisting of USD 80 billion of US Treasury securities and USD 40 billion of mortgage-backed securities. These substantial purchases have been an important part of the Fed’s response and have reduced the supply of US Treasury securities that the market would have otherwise needed to absorb. Chart 2 shows the outstanding US Treasury notes and bonds and the adjusted amount less the Fed’s holdings of these securities in its System Open Market Account (SOMA). The significant fiscal policy response to the pandemic can be seen in the sharp rise in US Treasuries issuance of over USD 3 trillion since March 2020. Contrast this with the much smaller net increase of just over USD 1 trillion and it is clear that the Fed was leaning into the increased debt issuance at an opportune time. While the Fed is unlikely to use this characterisation, we view the impact of QE asset purchases in reducing the call on markets to fund the increasing US budget deficit as an intended consequence of the policy and an important factor keeping yields low.
Chart 2: US Treasury notes and bonds on issue
 Source: Bloomberg, Nikko Asset Management Asia, October 2021
The impact on the net supply of US Treasury inflation-protected securities (TIPS) is even more pronounced. Chart 3 shows the outstanding US Treasury notes and bonds and the adjusted amount less the Fed’s holdings of these securities in its SOMA. The Fed’s QE purchases of TIPS has actually reduced the net supply of TIPS to USD 85 billion less than was available prior to the pandemic. Once again, we view this as an important factor that suppressed yields and drove 10-year real yields from about 0% at the start of 2020 to below negative 1%, providing significant support to the US economy.
Chart 3: US TIPS on issue
 Source: Bloomberg, Nikko Asset Management Asia, October 2021
As the Fed draws nearer to beginning the process of gradually tapering its asset purchases, investors will need to consider what nominal and real yields are attractive enough to take on more of US debt issuance in the year ahead. We believe that higher yields will be needed over time as the Fed backs away from its purchases and that the pressure will be most acute on the sharply negative real yields, that only the Fed could love.
Conviction views on defensive assets
- China bonds still favoured: China’s government bonds offer higher yields and lower volatility while credit growth is slowing, and a reserve requirement ratio (RRR) cut is expected this quarter.
- Shorter duration in dollar-bloc bonds: Fed tapering is expected to begin this quarter, joining the Bank of Canada and the Reserve Bank of Australia that have already begun to reduce purchases.
- • UK gilts to be avoided: : Gilts have begun to underperform global peers and we expect this to continue as the Bank of England leans towards a more hawkish future policy.
Process
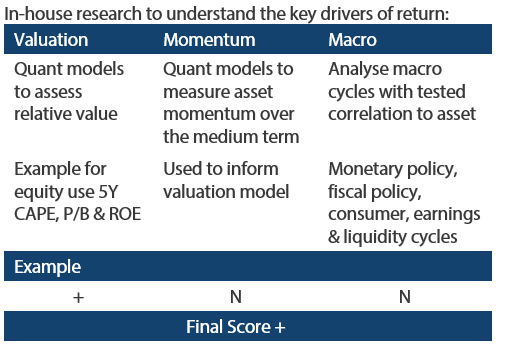
In-house research to understand the key drivers of return:
