


Snapshot
January was a positive month for most asset classes, with both bonds and equities rising after weakening the previous month. Global equities moved higher after a slow start to the year with the MSCI World Index rising by 3.4% during the month. Meanwhile, the Bloomberg Global Aggregate Bond Index gained 0.6% in USD terms. Both the S&P 500 and Nasdaq indices continued their upward trend following the inauguration of President Donald Trump as he began his second term focused on introducing a new era of US exceptionalism. Outside of the US equity market, Europe demonstrated strong performance, rallying on the possibility of a ceasefire in the Russia-Ukraine war. Likewise, Latin America was also robust, with most of its currencies strengthening against the US dollar. Market performance in Asia was mixed. China was flat as its market was closed for two weeks due to the Lunar New Year. South Korea rebounded from its lows on improved market sentiment. The ASEAN markets struggled on fears of Trump potentially targeting the region with tariffs.
In the bond market, the 10-year US Treasury (UST) yield initially rose to 4.80% earlier in January. However, the market recovered, and the 10-year UST yield ended the month at 4.54%, marking a decline of 3 basis points (bps) since the start of the month. The bond market remains volatile as it comes to grips with US Federal Reserve (Fed) policy developments. Current expectations project a policy rate of around 4% in two years' time. US economic data remains strong, with inflation, at 3.0%, remaining above the Fed's target and the unemployment rate stabilising around 4%. The robust data and sticky inflation implies that policy rates should remain higher for longer, despite the consistent market anticipation for interest rate cuts. Outside of the US, other central banks remain in easing mode, with the European Central Bank (ECB) and Bank of Canada (BOC) both easing by 0.25% during the month. Softer inflation in countries such as Australia and New Zealand has also prompted them to enter an easing cycle. Consequently, while we may see the US take a more hawkish tone on interest rates, more expansionary conditions are being delivered globally.
Cross-asset 1
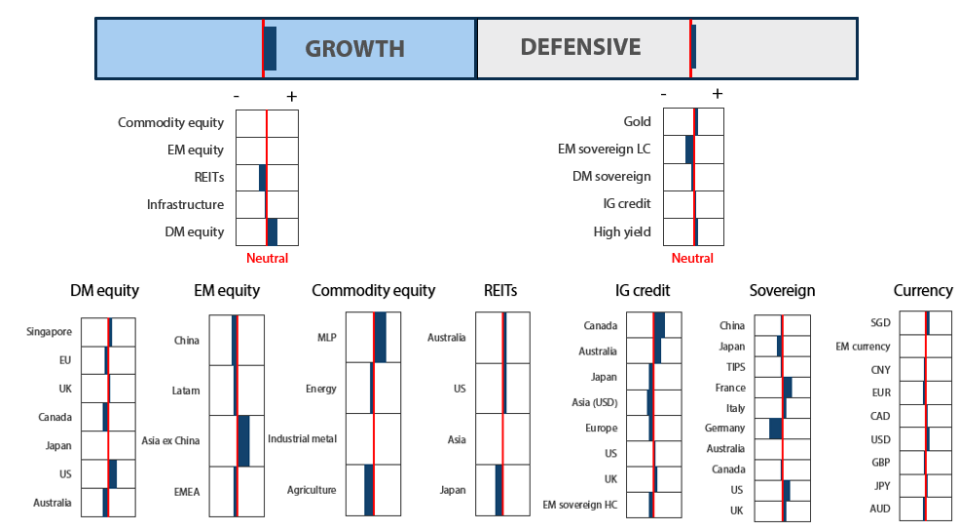
For January, we reduced our overweight position in growth while maintaining our overweight position in defensives. With respect to growth assets, Trump's second presidency ushers in a new era of US exceptionalism which has implications on the rest of the global markets. US data continues to indicate that the world's largest economy is performing strongly, and markets expect strong earnings growth for 2025. We retained our overweight position in defensives to reflect the better value in the bond market following the recent sell-off in yields. In addition, with the fall in cash rates, the hedging costs of owning offshore bonds improved and portfolios are looking to take advantage of this as bond curves steepen.
Within the cross-asset scores of growth, we reduced our overweight in developed market (DM) equities and retained our neutral position on emerging market (EM) equities. The Trump administration is poised to introduce higher import tariffs, which could alter our views on global risk assets outside of the US. Likewise, investors view Trump's policies as inflationary, implying higher for longer US policy rates and a stronger dollar. We still retain our positive view on growth, supported by resilient economic data and global monetary policies which, outside of the US, are generally dovish with inflation levels now nearing central bank targets.
Within DM, we remain overweight in the US on the back of better visibility driven by secular growth themes, and we retained our neutral position in Japan. We are underweight in Europe, as we think import tariffs and China's economic weakness could pose challenges for the region. We continue to like Japan for its longer term structural story of improving corporate governance and earnings growth momentum, but we maintain our neutral position due to yen volatility.
We look to eventually neutralise our position in energy given Trump's energy policies, which could benefit the sector via increased volumes. Within infrastructure, we continue to like US utilities to reflect our positive view on increasing energy demand with the secular growth of data centres. Within EM, we continue to favour selective countries like India, which is seen benefitting from a domestically-driven economy and structural long-term growth stories. Likewise, we retained our overweight position in Taiwan, which is a beneficiary of the current global tech upcycle.
Our view on defensives remains positive, as steeper curves and falling cash rates make available yields more attractive. Despite this, we reduced our overweight to spread products, trimming our overweight positions in both Investment Grade Credit and High Yield. While we still believe that global growth will remain strong and support credit markets, spreads have now hit levels where historical data indicates that a further contraction would be difficult. This means that the sector becomes more about carry, and as bond curves steepen, we are prompted to shift our allocation to other segments of defensives.
In place of spread products, we increased our score to DM sovereigns, as we now see the UST market as more attractive given that the hedging costs associated with the dollar has fallen substantially. Additionally, we increased our overweight to gold, an asset that has performed well as governments increase the size of their budget deficits. Looking forward, we expect the bond markets to provide more consistent returns relative to the results seen over the past two years, as steeper bond curves offer better levels of carry and roll to portfolios.
Asset Class Hierarchy (Team View 2 )
Research views
Growth assets
Growth assets remain attractive as US economic data remains resilient, even though inflation appears to be stickier than market expectations. On the other hand, economic data from the rest of world remains bleak. Falling inflation supports global central banks' decisions to lower interest rates as they pivot away from restrictive monetary policies.
After taking office, Trump announced steep tariffs on Canada and Mexico, which were subsequently pushed back after leaders agreed to tighten borders and address trade balances. The markets brushed off Trump's announcements as part of his negotiation tactics and see further escalation as unlikely. On the other hand, the US imposed a 10% tariff on all Chinese imports, and China retaliated in kind. However, the markets reacted positively as the tariffs were less severe than expected. Corporate earnings, which have been resilient across most regions, remain key to our risk-on view. Earnings growth continued on an upward trajectory, supporting growth assets—albeit now with a higher hurdle rate—amid a higher-for-longer interest rate environment in the US and a stronger dollar.
Equities reporting season scorecard
So far, more than half of the US companies in the S&P index have reported their quarterly earnings. The results have been encouraging, with 77% of those companies exceeding consensus estimates, compared to the historical average of 74% beats. The degree of these surprises has also been significant, with earnings exceeding street estimates by 5.7%. As a result, the earnings growth of the S&P index for 2025 has been revised higher to a 16% year-on-year increase, compared to the initial projection of 12% at the start of the year.
The US sectors that have registered positive surprises so far are communications, technology, financials and industrials, which have all exceeded the historical average of 74%. While technology has been driving the bulk of earnings surprises in previous quarters, it is encouraging to see performances broadening out, with sectors outside technology sectors (see Table 1) returning strong earnings surprises and growth. Financials have been rallying due to improved sentiments on higher interest rate environment and deregulation, which have been influenced by Trump's presidency and the Republicans regaining control of the US Congress. Industrials should also benefit from the recent PMI manufacturing index turning positive, especially as businesses are showing signs of wanting to replenish their stock.
Table 1: Earnings surprises broadening out to ex-Tech sectors
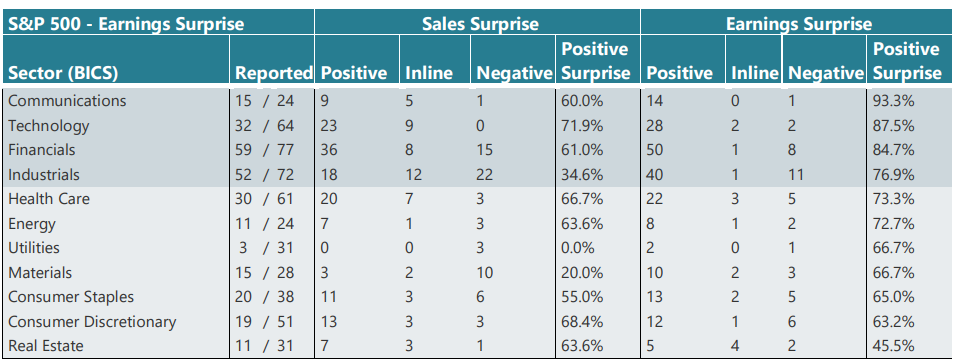
Source: Bloomberg, February 2025
Over in Europe, about 30% of the companies in the STOXX50 Index have reported their earnings. Even though it is still early in the reporting season, it is encouraging to see both sales and earnings beating market estimates by significant margins (Chart 1). Companies that have reported earnings surprises are tracking close to 69%, which is above the historical average of 62%, while sales surprises are coming in at 79%, which is above the historical average of 58%. However, quarter-over-quarter sales and earnings growth remain flat. This suggests that market estimates had de-rated significantly prior to the reporting season, thereby setting a lower benchmark to meet.
Despite continued weak economic data and lacklustre corporate earnings growth, the ECB's decision to cut interest rates in the face of decreasing inflation, coupled with relative valuation, has provided strong tailwinds to the region. Financials in Europe are the best performers year to date on the possibility of a ceasefire in the Ukraine-Russia war. Earnings growth in the region is more likely to happen in the second half of the year, hence we would be more inclined to stay on the sidelines until then.
Chart 1: Europe's surprisingly strong start to the reporting season
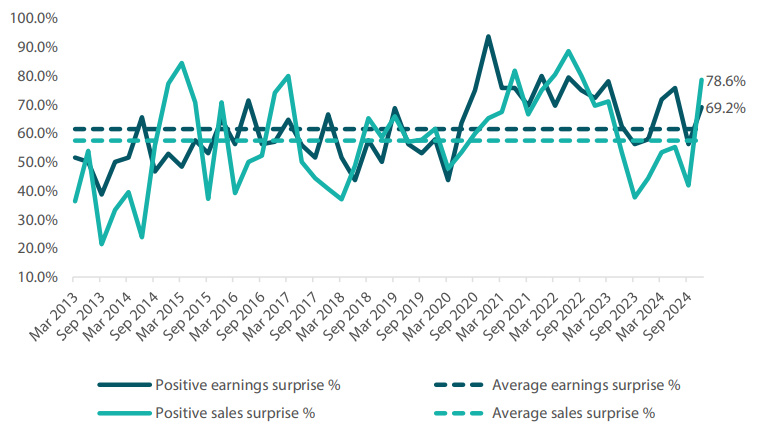
Source: Bloomberg, February 2025
In Japan, more than half of the companies have reported their earnings, with 60% of these companies revealing positive earnings surprises, compared to the historical average of 58%. Sales surprises, however, have been somewhat disappointing, with 48% of the companies reporting positive sales surprises compared to the historical average of 49%. Earnings growth for the quarter, which was close to 26%, was very strong, but this had been largely priced in by the market. The earnings appear to be inconsistent due to the volatility of the Japanese yen (Chart 2), as many of the companies are exporters with a weak yen serving as a boost to their earnings. We continue to like Japan's corporate restructuring story, including initiatives to improve corporate governance and return capital to shareholders, and we would look to increase our weighting in Japan once the yen stabilises.
Chart 2: Japan's corporate earnings appear inconsistent due to yen fluctuations
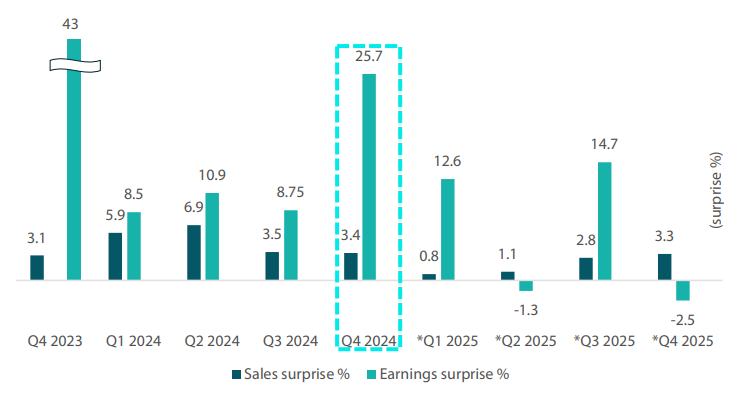
*Estimates
Source: Bloomberg, February 2025
Conviction views on growth assets
- Maintain exposure to US secular growth: We continue to like US tech-related stocks despite market concerns regarding the returns expected on investments made on artificial intelligence (AI) and data centres. Corporate earnings have been holding out well and the secular long-term growth story for the sector remains intact. Within the US, we are also starting to see the rally widening beyond the “Magnificent 7”, which is positive for the overall market. As inflation comes under control amidst a more dovish monetary policy, risk assets are expected to do well in US. Likewise, the Republican sweep is positive for equity markets as we expect to see continued strong fiscal spending and protectionism from the US to support its economy.
- Maintain exposure to EMs: We maintained a neutral position in EMs on the back of the Republican sweep. While we maintain our view that interest rate cuts will continue into 2025, the pace will likely slow, resulting in a stronger-than-expected dollar. A strong dollar historically would present headwinds for EM performance as central banks in the region will have less leeway to cut rates to stimulate their domestic economies. Within EMs, we still like selective markets, notably India, which benefits from a domestically-driven economy and structural long term growth stories. Likewise, we like Taiwan for its exposure to the global technology upcycle.
- Maintain Japan equities: We retained a neutral position in Japan equities in lieu of our view on the weaker yen amidst a stronger dollar. We still like Japan's structural reform story where we expect companies to increase their capital and dividend returns to shareholders. However, the volatility of the yen and a hawkish Bank of Japan juxtaposed against dovish central banks globally presents headwinds to sentiments. We will turn more positive on the country once we see its currency stabilising at a higher level.
- Upgraded on commodity-linked equities: We have moved from an underweight to a neutral position on the asset class. We rebalanced the weights from materials equities given weak sentiments and added into MLPs on strong defensive yields and a good structural story. We continue to believe that commodity-linked equities will continue to provide good diversification against inflation in the longer-term. The sector's fundamentals remain compelling due to both cyclical and secular fundamentals.
Defensive assets
Defensive assets have gotten off to a strong start in 2025, despite the volatile movements in UST yields. As global central banks ease interest rates, global bond markets are expected to be more favourable than they have been in the prior two years, even if the Fed decides to end its rate-cutting cycle early. Despite this, we have begun to reduce our Investment Grade credit positions, as spreads have hit relatively tight levels. This month's Balancing Act looks at outright spread levels and identifies the countries that still offer attractive spread pickups.
Credit spreads: where is the value left?
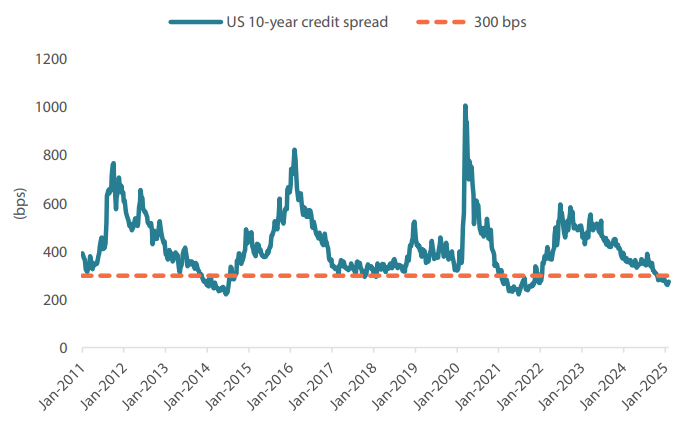
After narrowing for about two and a half years, credit spreads have now hit levels where further contraction is typically difficult. For example, US 10-year/BBB spreads have fallen to +271 bps, which is only marginally above the post-Global Financial Crisis (GFC) lows recorded in 2011, 2014, and 2021. Post-GFC, it has been relatively rare for BBB 10-year credit spreads to remain below 300 bps, with periods of decline below this figure totalling only 104 weeks (or 13% of the weeks) since 2010.
As shown in Chart 3, US credit spreads are typically a mean-reverting series, with the credit cycle typically lasting 24 months. Broadly speaking, once credit spreads contract to these tight levels, the risk of spread widening begins to outweigh the carry available on the bonds, as unexpected events can cause markets to widen. Accordingly, we have sought to reduce our overweight positions back to neutral. This is not because we hold a negative view on the US market, but rather because credit spreads are not compensating for any unforeseen risk.
Chart 3: US credit spreads have been mostly above 300 basis points
Source: Bloomberg, February 2025
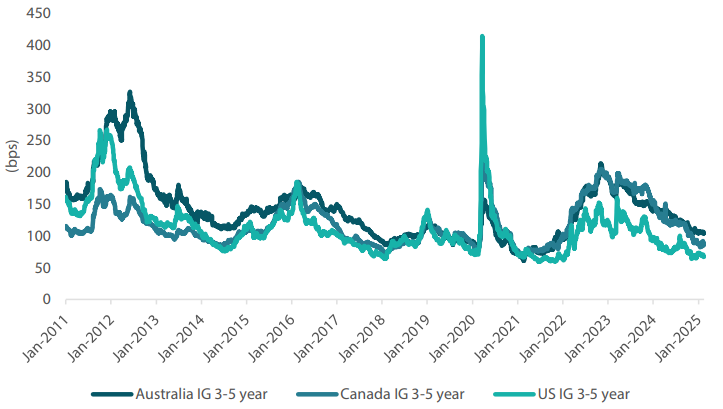
While markets such as the US have hit tight credit spread levels, this is not true of other countries. Some pockets offer attractive spreads, and markets with steeper bond curves can help make up for the lack of spread. Currently, we continue to favour Australia for credit exposure, as the spreads there still remain above 100 bps. Typically, Australian spreads lag the US contraction, although they eventually end up at similar levels. Another benefit the Australian market offers is its higher average credit quality, with major banks rated AA compared to the single A rating in most other markets. The portfolios also favour Canadian credit, as although its spreads are tighter than Australia's, they remain wider than those of the US. In addition, the BOC is currently in a strong easing cycle, with the market expecting the terminal cash rate at 2.50%, down from the initially anticipated 5%. This could stimulate growth in the Canadian economy, with early indicators suggesting that the sub-1% growth of 2024 is ending, which is a positive sign for credit spreads.
Therefore, while credit spreads are now becoming tight by historical standards, we still see some areas of value that warrant an allocation. Such a strategy will likely be more defensive than in the past two years, probably focusing on single A issuers rather than those rated BBB. The benefit for portfolios is that higher hedged yields can be achieved by allocating across geographies, and as Chart 4 shows, all markets typically move in a similar fashion in cases where spreads widen.
Chart 4: Credit spreads by country
Source: Bloomberg, Nikko AM, February 2025
Conviction views on defensive assets
- Defensive IG credit allocations: Credit spreads are hitting tight levels that they have historically struggled to contract further. Despite our positive outlook for global growth, we have started to take a more cautious view of credit spreads and are focusing on achieving stable carry in the front end of the bond curve.
- Gold remains an attractive hedge: Gold has been resilient in the face of rising real yields and a strong dollar, while proving to be an effective hedge against geopolitical risks and persistent inflation pressures. Falling real yields should benefit the asset class and we use this allocation to supplement our long bond positioning.
- Adding duration: Although central bank easing cycles might end more quickly than expected, the global curve steepening makes bonds look more attractive. We have upgraded our UST scores from neutral to overweight and are seeking a 10-year yield of around 4.75% to 5% to add additional duration.
Process
In-house research to understand the key drivers of return:
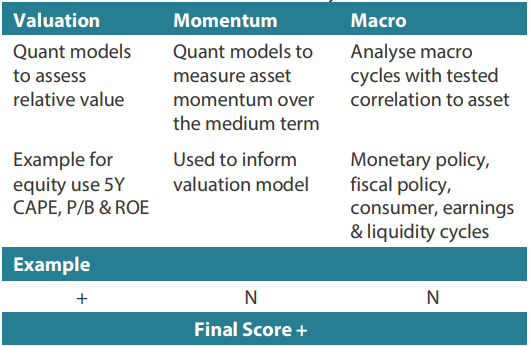
1 The Multi Asset team's cross-asset views are expressed at three different levels: (1) growth versus defensive, (2) cross asset within growth and defensive assets, and (3) relative asset views within each asset class. These levels describe our research and intuition that asset classes behave similarly or disparately in predictable ways, such that cross-asset scoring makes sense and ultimately leads to more deliberate and robust portfolio construction.
2 The asset classes or sectors mentioned herein are a reflection of the portfolio manager's current view of the investment strategies taken on behalf of the portfolio managed. The research framework is divided into 3 levels of analysis. The scores presented reflect the team's view of each asset relative to others in its asset class. Scores within each asset class will average to neutral, with the exception of Commodity. These comments should not be constituted as an investment research or recommendation advice. Any prediction, projection or forecast on sectors, the economy and/or the market trends is not necessarily indicative of their future state or likely performances.
