Snapshot
November was a positive month for most asset classes, with both bonds and equities appreciating over the month. Equities led the charge following the Republican victory in the US presidential election, with the MSCI World Index rising by over 4% during the month. Meanwhile, the Bloomberg Aggregate Bond Index rose by over 1% in US dollar terms. It was a US-led story during November, as the election saw the Republicans take charge, and the market focused on the potential introduction of corporate tax cuts. US equities showed extremely positive returns, with the S&P 500 gaining over 5.5% to finish the month at an all-time high of 6,032 points. Outside of the US equity market, performance was more mixed, as the market came to terms with what a Trump presidency could mean, and in particular, whether tariffs will be negative or positive for global economies. This saw the EuroStoxx 50 fall by 0.48% over the month in euro terms; however, this further exacerbated losses in dollar terms with the US currency strengthening.
In the bond market, despite Donald Trump and the Republican party being viewed more broadly as inflationary, bonds posted a gain for the month. US 10-year Treasury yields closed the month down 11 basis points (bps) to end at 4.17%. While the market originally sold off on the election outcomes, Scott Bessent—the potential pick for the next US Treasury secretary—commented on a target of reducing the US deficit to 3% of GDP and produce an additional three million barrels of oil per day. These comments were viewed positively by the bond market, but less so by the oil market. Oil prices dropped 1.8% during the month, pulling breakeven inflation rates lower in the bond market. Finally, the US dollar continued its ascent higher, with the euro ending the month at 1.05. The easier path of policy in Europe and potential for higher-for-longer rates in the US could keep the euro under pressure in the near term.
Cross Asset 1
For the month of November, we slightly reduced our overweight growth position and increased our position in defensives. With respect to growth assets, the start of the US Federal Reserve (Fed)'s interest rate cutting cycle and the return of a Republican presidency are viewed as positives for risk markets; however, our downgrade in growth assets reflected a reduction in risk in portfolios following November's extremely strong market performance. US data continues to show that the economy is performing strongly, and markets expect strong earnings growth for 2025. On the defensive side, we have increased our position to reflect the better value in the bond market following the sell-off in yields. Additionally, as cash rates continue to fall, the hedging costs of owning offshore bonds improve, and portfolios are beginning to achieve strong yields as bond curves steepen.
Within the cross-asset scores of growth, we retained our overweight in developed market (DM) equities but moved to neutral on emerging market (EM) equities given our view on a stronger dollar, which potentially is negative for EMs. The red sweep by the Republicans could rekindle memories of more import tariffs, which could be inflationary and hence lead to a higher-for-longer interest rate environment. This means EM central bankers would have less leeway to cut interest rates to stimulate their economies while needing to maintain local currency strength. Meanwhile, we retain our positive view on growth on resilient economic data and dovish monetary policies globally as inflation starts to ease worldwide. Within DM, we maintained our overweight in US on the back of better visibility driven by secular growth themes. We rebalanced our risk exposures by adding to Japan and moving to an underweight position in Europe on better risk reward. We continue to like Japan for its longer term structural story of improving corporate governance and earnings growth momentum but maintain our neutral position on the near-term headwinds of yen volatility. Within commodity equities, we maintained our underweight in energy, seeing how pessimism has grown amidst growing oversupply and slowing demand. Within infrastructure, we retained our preference for US utilities to reflect our positive view on increasing energy demand with the secular growth of data centres. Within EM, we continue to like selective countries like India which will benefit from domestically-driven economies and structural long term growth stories. Likewise, we retained our overweight position in Taiwan which is a beneficiary of the current global tech upcycle.
Within defensives, investment grade (IG) credit was increased to a larger overweight while gold was downgraded. The shifts this month reflect the positive view of the corporate environment following the Republican win and improved hedged yields that are now available in the IG space. Falling rates and tax cuts in the US are expected to be positive for credit spreads, and accordingly, our largest overweights are in high yield (HY) and IG credit. However, we keep these as only modest positions, as credit spreads have reached relatively tight levels, and there is little room left for spread contraction. Within DM sovereigns, we also marginally increased our score but remained underweight, as the sell-off in yields and steepening of global curves make bonds marginally more attractive. We funded these positions via a reduction in gold, which was moved back towards neutral. We still see gold as a strong diversifier that should perform well given the large fiscal deficits globally. However, gold has had extremely strong returns year-to-date and with higher hedged yields available, the asset class is now not quite as attractive relative to DM sovereigns as it was through most of the year.
1 The Multi Asset team's cross-asset views are expressed at three different levels: (1) growth versus defensive, (2) cross asset within growth and defensive assets, and (3) relative asset views within each asset class. These levels describe our research and intuition that asset classes behave similarly or disparately in predictable ways, such that cross-asset scoring makes sense and ultimately leads to more deliberate and robust portfolio construction.
Asset Class Hierarchy (Team View 2 )
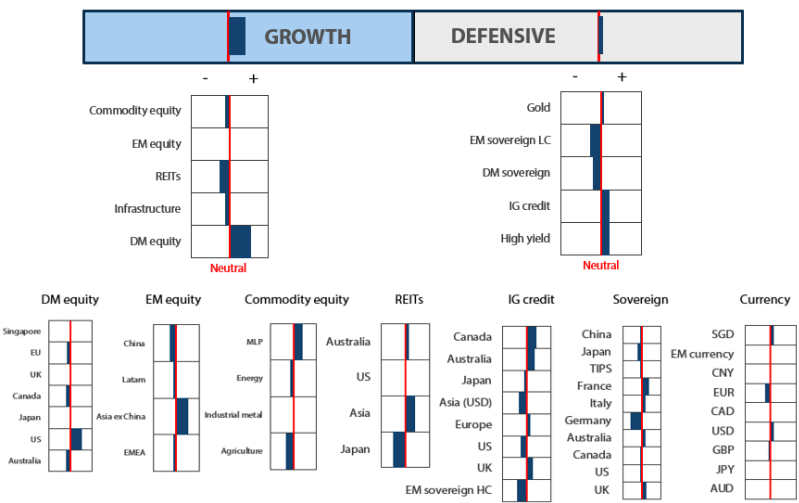
2 The asset classes or sectors mentioned herein are a reflection of the portfolio manager's current view of the investment strategies taken on behalf of the portfolio managed. The research framework is divided into 3 levels of analysis. The scores presented reflect the team's view of each asset relative to others in its asset class. Scores within each asset class will average to neutral, with the exception of Commodity. These comments should not be constituted as an investment research or recommendation advice. Any prediction, projection or forecast on sectors, the economy and/or the market trends is not necessarily indicative of their future state or likely performances.
Research views
Growth Assets
Growth assets are attractive given that economic data remains resilient against falling inflation and as global central banks lower interest rates as they pivot away from restrictive monetary policies. The US elections, which resulted in a Republican red sweep, could lead to increased fiscal spending and higher import tariffs, potentially reigniting inflationary pressures. This could mean a higher-for-longer rates outlook and a stronger dollar. However, expectations towards the Trump administration implementing corporate tax cuts, along with the current rate-cutting cycle, remain powerful drivers of returns.
Deciphering various valuation metrics
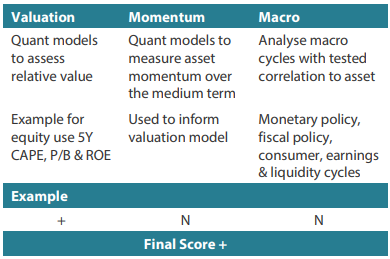
Investors are increasingly becoming concerned about the stretched valuations in the US market. Despite such concerns, the US market has continued to hit new highs in recent months. The question on most investors' minds is when and if the US market will correct and to what extent. The problem with most of these arguments is that they are based on the price to earnings multiple (PER) that investors tend to use. To address the issue, we need to delve into the various valuation metrics, understand why they are used and recognise the potential pitfalls of solely relying on them.
Using PER as a valuation metric offers strong advantages given the simplicity of valuation, and it has been often used as a tool for mean reversion. However, we need to understand that PER multiples can de-rate or re-rate over time as earnings profiles change or when influenced by external factors such as interest rate environment changes. Put simply, companies with stronger earnings visibility tend to be rewarded with higher PER multiples. Likewise, PER can remain depressed for an extended period if earnings profiles are lacklustre. The problem with using PER is that earnings can be volatile and subject to frequent revisions by analysts, making PER less reliable and prone to regular adjustments. In addition, PER tends to be short term, focusing on a 12-month period, and this fails to account for longer-term earnings growth profiles, which can potentially lead to a shortsighted investment perspective.
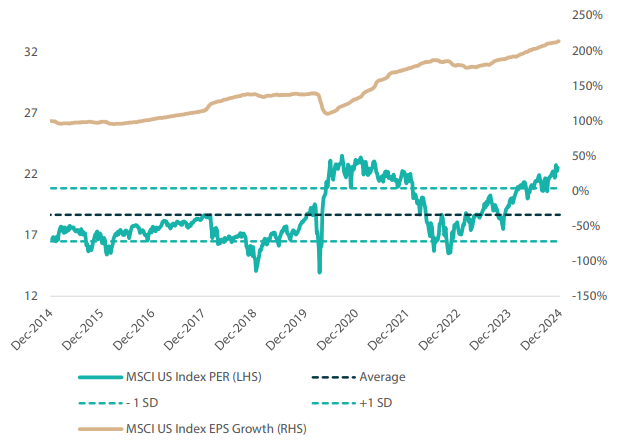
Interestingly, a review of the MSCI Emerging Market Index's PER compared to its earnings growth in the past decade (See chart 1) shows that earnings growth has been almost stagnant over this period, with the PER trending close to historical mean, which appears fitting. If we compare this with chart 2, which shows MSCI US Index earnings growing more than 200% over the same period, the US PER is now trading close to one standard deviation above its historical mean. This could mean that the US is either overvalued, or that there has been a re-rating of the PER due to the resilience of earnings growth.
Chart 1: MSCI Emerging Market Index PER vs EPS growth

Source: Bloomberg, December 2024
Chart 2: MSCI US Index PER vs EPS growth
Source: Bloomberg, December 2024
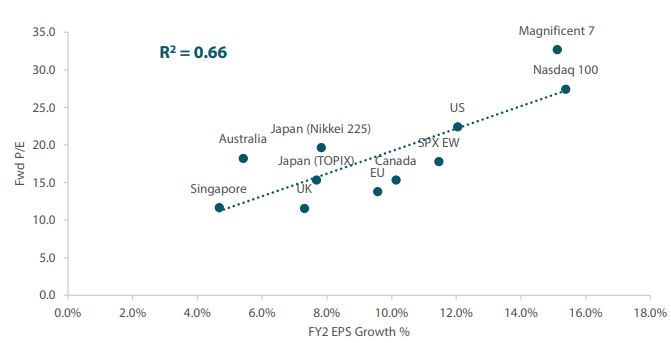
To understand why some PERs are higher than others, we can see that it has a positive correlation with the earnings growth profile. The MSCI US Index and Nasdaq have higher PERs due to their higher earnings growth. If we draw comparisons across various regions, we can see that they are fairly valued. The key question for investors then would be whether the earnings profile can be maintained in the future. Likewise, at first glance, UK and Canada might look cheap based on this metric, but underlying factors such as overly optimistic earnings could make them susceptible to corrections. Similarly, Japan's Nikkei might look expensive because analysts may have been too negative about earnings, suggesting potential for upgrades. We believe that adopting a qualitative overlay—that is, understanding the various factors—is critical to making informed investment decisions.
Chart 3: Forward PER vs fiscal year two (FY2) earnings growth across various regions
Source: Bloomberg, December 2024
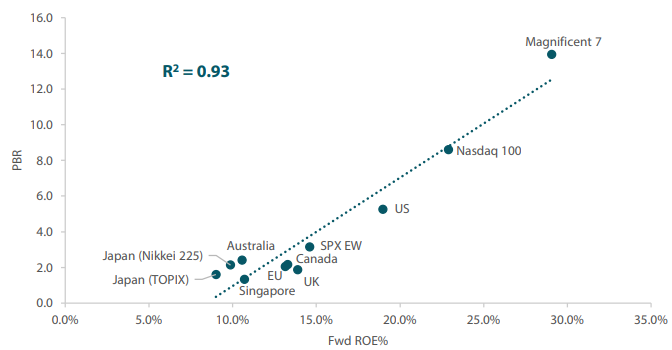
Another metric which we find useful is the price-to-book ratio (PBR) against the return on equity (ROE), which has a positive correlation and is more stable compared to PER and earnings growth. It appears that the various bourses are closely correlated to the multiples at which they are currently trading, which seems to imply that markets are efficiently priced. The MSCI US Index and Nasdaq might look appealing at the current levels as valuations do not seem overstretched at this point. The downside of the metric is the potential inaccuracy of the book value. Specifically, the book value overlooks elements like goodwill and returns, which, despite being less volatile than earnings growth, are also prone to adjustments. Regardless, using this metric in conjunction with PER and earnings growth could definitely provide a better understanding of the underlying valuation, in our view.
Chart 4: PBR vs forward ROE across various regions
Source: Bloomberg, December 2024
Unfortunately, there is no one-size-fits-all solution when it comes to choosing valuation tools. However, understanding the various factors that can affect the quantitative inputs can help to improve the investment-making process. Understanding various macro cycles is also important from a top-down asset allocation perspective as it helps calibrate nuances that may affect the valuation of the various regions. Last but not the least, it is imperative to incorporate a qualitative overlay over the investment decisions for achieving better outcomes. Estimating whether earnings will beat or miss market expectations is key to calibrating our valuation models and making accurate predictions.
Conviction views on growth assets
- Maintain exposure to US secular growth: We continue to like US tech-related stocks despite market concerns regarding the returns expected on investments made on artificial intelligence (AI) and data centres. Corporate earnings have been holding out well and the secular long-term growth story for the sector remains intact. Within the US, we are also starting to see the rally widening beyond the “Magnificent 7”, which is positive for the overall market. As inflation comes under control amidst a more dovish monetary policy, risk assets are expected to do well in US. Likewise, the red sweep by the Republicans is positive for equity markets as we expect to see continued strong fiscal spending and protectionism from the US to support its economy.
- Reduce exposure to EMs: We shifted to a neutral position in EMs on the back of the Republicans' red sweep. While we maintain our view that interest rate cuts will continue into 2025, the pace will likely slow, resulting in a stronger-than-expected dollar. A strong dollar historically would present headwinds for EM performance as central banks in the region will have less leeway to cut rates to stimulate their domestic economies. Within EMs, we still like selective markets in India which benefit from a domestically-driven economy and structural long term growth story. Likewise, we like Taiwan for its exposure to the global technology upcycle.
- Upgrade Japan equities to neutral: We upgraded to a neutral position in Japan equities in lieu of our view on the weaker yen amidst a stronger dollar. We still like Japan's structural reform story where we expect companies to increase their capital and dividend returns to shareholders. However, the volatility of the yen and a hawkish Bank of Japan juxtaposed against dovish central banks globally also presents headwinds to sentiments. We will turn more positive on the country once we see its currency stabilising at a higher level.
- Remain underweight on commodity-linked equities: Given the slowing economic data and energy oversupply, we retained our underweight exposure in the asset class. We remained overweight on MLPs on strong defensive yields and good structural story. We continue to believe that the commodity-linked equities will continue to provide good diversification against inflation in the longer term. The sector's fundamentals remain compelling due to both cyclical and secular fundamentals.
Defensive assets
With the beginning of the global rate-cutting cycle, sovereign bond curves are steepening and bonds are gradually becoming more attractive. Economic data remains weak outside of the US, and it appears that the easing trend may continue across the world in 2025. As a result, we have increased our DM sovereign score marginally, and pushed our defensive score higher as the hedged yields that are now available are becoming increasingly attractive. In addition, we expect that the easing trend will be supportive of global economic growth, which should see credit spreads continue to perform well. This month's Balancing Act focuses on a broader view of central bank data, and the recent shift in Australian data that suggests the Reserve Bank of Australia (RBA) will join the group of rate -cutting banks in 2025.
Global central bank data
As 2024 draws to a close and 2025 comes into view, it is an opportune time to review the economic data across the globe to determine which central banks may need to change course in the next 12 months. When examining DMs, the economies can be separated into two tiers, with the US performing well and most others struggling. This trend can be seen in Table 1 below, in which the headline economic statistics of the developed economies are compared. The US is the only country with growth above 2%, which suggests that central banks outside of the US may need to ease faster.
Table 1: Central bank policy rates and headline statistics of developed economies

Source: Blomberg, December 2024
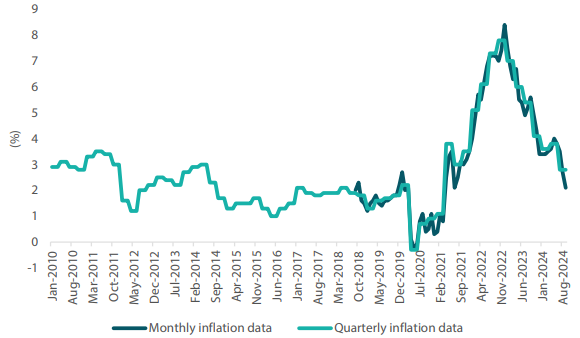
While the market has been pricing in continued easing by Canada, Australia is another country that should see its policy rate begin to deviate from the US outlook. This is primarily due to the slowdown of Australia's GDP to 0.8% year-on-year (YoY), which, outside of the COVID lockdowns, is the slowest pace of growth since the early 1990s. And while Australia's headline inflation rate remains high at 2.8%, this is a quarterly data release which can be slow to reflect changes. The more recently produced monthly data release, which is not officially used by the RBA, has already slowed to 2.1% (YoY), signalling that inflation is squarely back in the RBA's 2–3% target band.
Chart 5: Australian inflation in monthly vs quarterly figures
Source: Bloomberg, December 2024
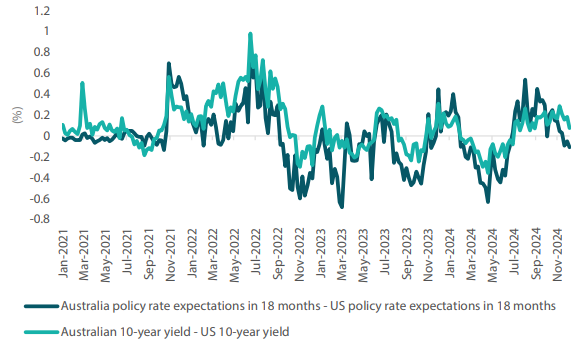
From a positioning perspective, this has led to an overweight allocation to Australian government bonds relative to US Treasuries. Just how far Australian bonds can fall relative to their US peers will depend on how the RBA responds to slowing inflation and growth, as interest rate differentials typically drive the yield difference. We expect Australian policy rate expectations to continue falling relative to the US, which should drag Australian 10-year bond yield further below the US 10-year yield. Similar to developments in Canada in 2024, this could potentially set the scene for Australian bonds to outperform in 2025, as the economic situation appears to be cooling far faster than in the US.
Chart 6: Australia, US policy rate differential and 10-year bond yield differential
Source: Bloomberg, December 2024
Conviction views on defensive assets
- IG credit and high yield: Credit spreads remain at fair levels, but as central banks ease, global growth should improve. With steeper bond curves and stronger levels of hedged yield, we look to use credit to add yield across all portfolios.
- Gold remains an attractive hedge: Although we did reduce our score, gold has been resilient in the face of rising real yields and a strong dollar, while proving to be an effective hedge against geopolitical risks and persistent inflation pressures. Falling real yields should benefit the asset class and we use our reduction in the gold score to supplement our long bond positioning.
- Adding duration selectively: As central banks begin to ease rates, this should be beneficial to bond markets globally. Picking the timing for rate cuts can be difficult; however, as restrictive policy comes to an end, this should be positive for bonds. We currently prefer markets where central bank policy rates are expected to fall the most, with the ECB and RBA meeting that criterion over the coming months.
Process
In-house research to understand the key drivers of return:
