Snapshot
The repricing of markets to match the “higher for longer” narrative may have now run its course, seemingly peaking in October when equities and bonds were highly correlated to the downside. We have held on to our view that “higher for longer” is not necessarily bad for equities, as robust earnings are supported by a US economy that continues to grow at above-trend rates. However, we are also sympathetic to the de-rating process where earnings look simply less attractive compared to higher rates across the yield curve.
Central banks seem comfortable with the magnitude of monetary policy tightening to date, acknowledging the lift in long-term rates that is expected to help to cool the economy in the months ahead. The global rate hiking cycle appears mostly complete, at least for now, perhaps ending the six-month sell-off in rates that drew in equities over the last three months.
We believe the odds lean in favour of continuing relief for markets on the back of overly bearish sentiment receding and strong seasonal factors heading into the year-end. Valuations remain attractive across many asset classes and US earnings continue to defy market pessimism. As the dust settles, we see many decent fundamental opportunities to support a better finish to 2023, taking some of the sting out of the lengthy bear market in bonds—the worst in history—which we believe has mostly (finally) run its course.
Cross-asset1
We reduced our growth score to neutral and marginally increased our defensive score again to a slightly larger overweight. The depth of the sell-off in US equities surprised us given that economic growth remains resilient, a notion which has been further reinforced through a decent third-quarter reported earnings season. However, from a cross-asset perspective, given the lift in yields, it is not surprising that flows have been attracted away from equities and into bonds where returns look more durable from a risk-return perspective. As cash yields rise, the risk-return favours short-dated instruments that have decent carry and limited duration risk relative to equities where yields are lower—with equities relying much more heavily on earnings expansion (and therefore decent economic growth) to meet or exceed the return potential of credit.
From an economic perspective, above-trend growth outcomes have also come as a bit of a surprise given the extent of aggressive monetary policy tightening. However, it seems that strong US fiscal spending has offered a notable and powerful offset to keep the economic wheels turning. At this juncture, the fiscal impulse is slowing at the margin— mainly driven by the resumption of student loan payments. This is just one data point but it could prove to be important given our belief that easy fiscal policy was a key offset to tight monetary policy. We do not know if or when growth will roll over in the US, but on a net basis, we favour attractive yields over opportunistic growth on a risk-adjusted basis, particularly when one measures the yield against the potential for growth weakness.
Within our growth asset allocations, we still favour mainly commodity-linked equities as a hedge against inflation, which is coming down more slowly than hoped. The overweight to commodity-linked equities is funded by underweights to REITs and infrastructure where yields still look skimpy relative to cash rates. Within defensives, we increased gold to a larger overweight as a better risk hedge, funded from developed market (DM) sovereigns and emerging market (EM) local currency sovereigns.
1The Multi Asset team’s cross-asset views are expressed at three different levels: (1) growth versus defensive, (2) cross asset within growth and defensive assets, and (3) relative asset views within each asset class. These levels describe our research and intuition that asset classes behave similarly or disparately in predictable ways, such that cross-asset scoring makes sense and ultimately leads to more deliberate and robust portfolio construction.
Asset Class Hierarchy (Team View2)
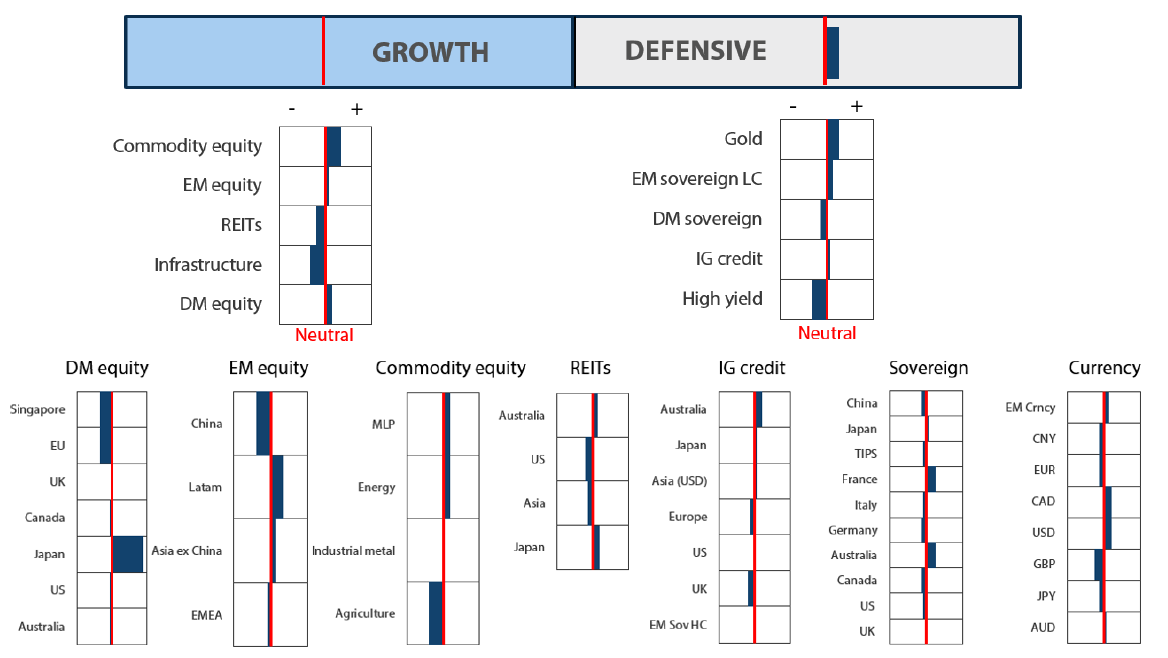
2The asset classes or sectors mentioned herein are a reflection of the portfolio manager’s current view of the investment strategies taken on behalf of the portfolio managed. The research framework is divided into 3 levels of analysis. The scores presented reflect the team’s view of each asset relative to others in its asset class. Scores within each asset class will average to neutral, with the exception of Commodity. These comments should not be constituted as an investment research or recommendation advice. Any prediction, projection or forecast on sectors, the economy and/or the market trends is not necessarily indicative of their future state or likely performances.
Research views
Growth assets
We are neutral on growth assets more as a function of emerging yield opportunities than having specific concerns about the growth outlook. No doubt, given the extent of tightening and very tight financial conditions through October, growth will likely slow in the months ahead. However, the headwind may blow stronger on cyclicals than structural growth opportunities such as in Japan and US tech.
The key tailwinds keeping the US economy afloat are a decent fiscal thrust and strong private sector balance sheets, including a healthy stockpile of excess savings driven by COVID stimulus that is dwindling as consumers spend it. But our analysis suggests that some COVID stimulus still remains to serve as a buffer. The key risk, in our view, is rising unemployment, which looks to be on the cusp of indicating more pain ahead. Even then, it is difficult to say because companies appear to be investing.
While we like specific geographies and segments of the global equity market, relatively short-dated credits offer compelling yields, particularly on a risk-adjusted basis given they rarely return negatively—even in a recession. Still, equities play a role to capture growth opportunities and to naturally hedge inflation as revenues tend to follow nominal growth.
Equities caught in a cross-asset shift
Correlations between equities and bonds remain extremely tight, but this condition tends to follow uncertainty driven by the velocity of the change in rates. As the “higher for longer” narrative dissipates and growth concerns come back to the fore, correlations could likely shift to the negative as they did back in March during the banking crisis. Still, some of the shift in positioning is likely to prove more durable.
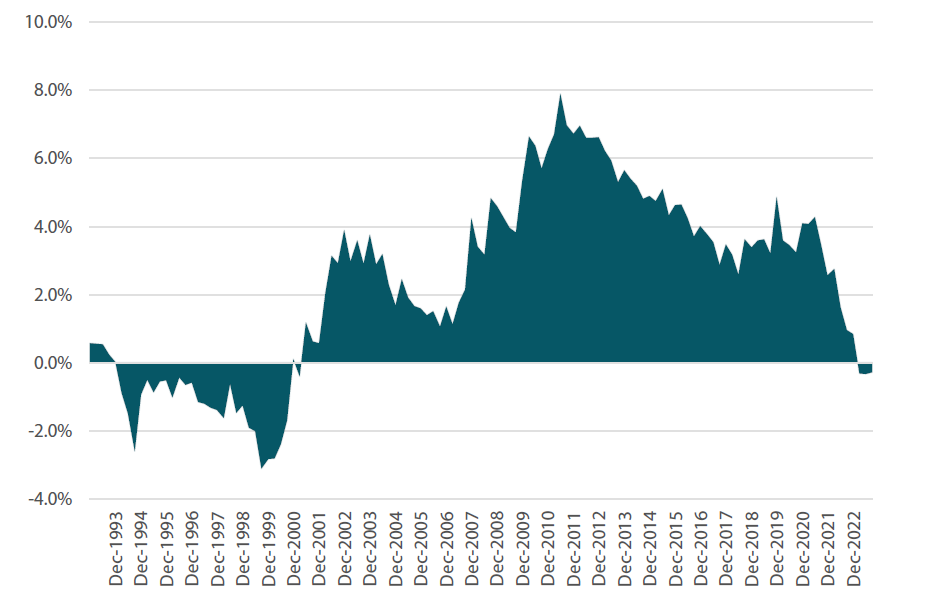
Quite simply, for those investors primarily interested in yield, it is natural for their capital flows to gravitate away from equities back to fixed income. As short-term credit yields are reaching levels not seen since the 1990s, many investors are taking a second look at these yield instruments—particularly as their yield has recently eclipsed S&P 500 earnings yield for the first time since 2001.
The comparison to the “dot-com bubble” era is foreboding, but it is an apt comparison in terms of assessing yield versus growth opportunity. In the 1990s, the market bubble was driven by speculation and dreams, not from hard profits, so conservative investors were rewarded when the bubble burst. Today, profits and the strength of cashflow are very real, and we think it is sensible to keep a balance between conservative yield and secular growth.
Chart 1: Excess S&P 500 earnings yield above short-term credit
Source: Bloomberg, November 2023
We prefer secular growth in the form of Japan equities that benefit from reflation and significant structural reform that happen to also yield more than 7% when hedged back to US dollars. On this basis, Japan equities will be a high bar to beat simply because of their head start from the extra yield so long as rate differentials remain wide.
We also believe the US tech story remains strong on the back of generative artificial intelligence (AI), which so far has mostly benefited the largest companies like Microsoft, Meta and Nvidia to date. However, compelling applications in this space are in their infancy and while measures of improved productivity are still mainly anecdotal, the potential gains are quite considerable.
We believe AI will accelerate disruption with winners taking significant profits. It is impossible to determine winners and losers at this stage, but clearly large-cap companies with strong cashflow to invest have an early lead and a powerful advantage over those seeking capital that has become quite expensive. For now, we see this dynamic continuing, and retaining a favourable view of large-cap tech makes good sense.
Conviction views on growth assets
- Secular growth over cyclical yield: Equities bought for their yield (fixed income replacements), like utilities and REITs, have suffered for better yield alternatives in the fixed income space, and this dynamic is unlikely to dissipate for some time. When it comes to equity balance, secular growth like opportunities in Japan and tech offer the best opportunities in the months and potentially years ahead.
- Commodity-linked equities: Far from secular growth, commodity-linked equities remain the source of materials and energy that remain in relatively short supply. While inflation is dissipating, we do not see it returning to pre-COVID levels—partly driven by demand exceeding supply in this space, which offers a natural hedge.
- Selective emerging markets: We mainly like Taiwan and South Korea for their potential upside in the current turn of the tech hardware cycle, India for their vibrant (and profitable) growth, while Latin America (LatAm) is still a standout for yields and potential upside driven by “friendshoring” and easing rates.
Defensive assets
We slightly downgraded our view again on sovereign bonds within our defensive asset classes. The divergence in economic growth outcomes across countries has begun to be more well-defined, with the US continuing to experience above-trend growth, while Europe and the UK are showing signs of strain. Central banks, led by the US Federal Reserve (Fed), have been suggesting that rates may need to stay higher for longer than markets have been expecting since the start of the year. While recent meetings have resulted in no further rate hikes, central banks seem content to let rising long bond yields do some of the work for them.
At the same time, we upgraded our positive view on gold further and maintained our overweight view on investment grade (IG) credit. Gold prices were volatile in the recent month but have since stabilised relative to the US dollar and made new all-time highs against the Japanese yen. This strength in gold has held in the face of rising real yields and a strong dollar, two factors that usually sap demand for the precious metal. It has proven to be an effective hedge against geopolitical risks and elevated inflation pressures. Demand has also stayed strong as central banks continue to diversify their foreign reserves and investor positioning remains light.
IG credit continues to have attractive valuations relative to sovereign bonds. So far through 2023, the global economy has performed stronger than expected, US growth has begun to increase and IG spreads have been more resilient than previously thought. Looking forward in a higher-for-longer environment, IG credit spreads are expected to continue performing well as spreads offset some of the interest rate pain that has been felt.
Cash rate expectations converging
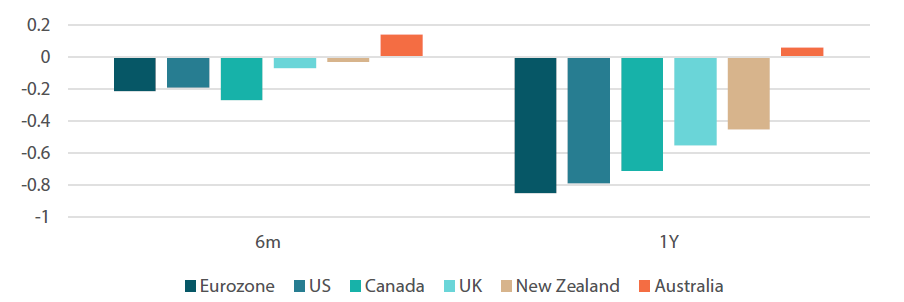
After one of the most aggressive interest rate tightening cycles globally over the past 40 years, market expectations for cash rates globally are now pointing to the hiking cycle coming to an end. Futures markets are pricing interest rate cuts across several countries, with cash rate expectations converging between 4.30% and 5.05% for countries including the US, Canada, UK, New Zealand and Australia. As Chart 2 below shows, the next six months are viewed as a holding period with mostly stable cash rates, before larger cuts begin in 6 to 12 months’ time. Australia is the only country in this data set which has expectations of minor hikes, reflecting the fact that the Australian cash rate is only 4.35% compared to 5.5% in the United States, 5.0% in Canada, and 5.25% in the UK.
Chart 2: Cash rate changes (market expectations)
Source: Bloomberg, November 2023
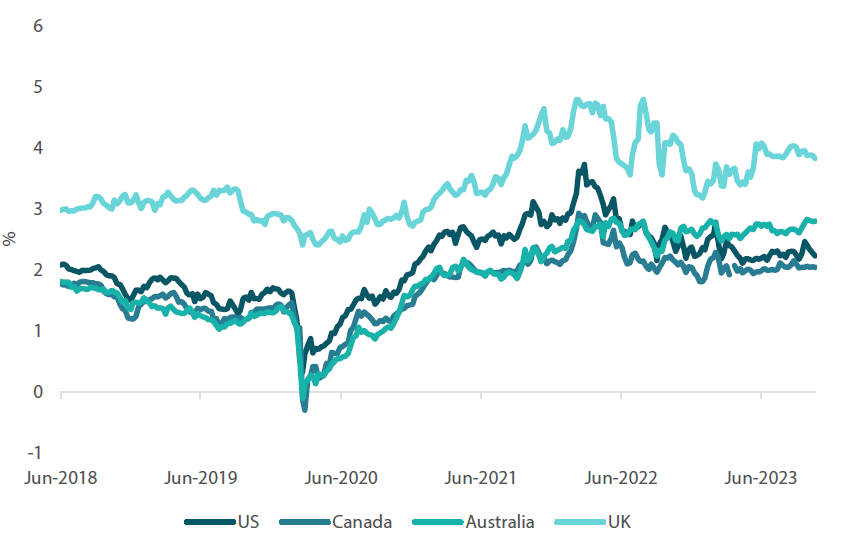
These market expectations reflect the fact that most central bankers believe that the cash rate is in restrictive territory and are achieving their objective of bringing inflation back in line with central bank targets. Interestingly, while inflation has been persistently high over the past 18 months, the breakeven inflation market has been expecting a more benign environment for the next five years. Market pricing for Canada and the US see inflation over the next five years only marginally above 2%, while Australia sits at 2.8% which is in the Reserve Bank of Australia’s 2–3% target band. Overall market pricing thus gives a good indication for why the markets are willing to start betting on cash rate cuts globally, and if inflation is back under control and cash rates are restrictive, it implies some easing will be required. The UK is the country which markets still believe will see high levels of inflation, as expectations run closer to 4%.
Chart 3: Five-year breakeven inflation
Source: Bloomberg, November 2023
However, while the market is willing to start taking bets on lower cash rates, the messaging so far from central banks such as the Fed is one of caution. When asked about interest rate cuts in the press conference after the 31 October-1 November Open Market Committee meeting, Fed Chair Jerome Powell responded that “the fact is the Committee is not thinking about rate cuts right now at all”, and later went on to say that “it’s fair to say… the question we’re asking is, should we hike more”. This caution seems to stem from the Fed’s view that they need to ensure that they have completed the job of taming inflation, before signalling that conditions can move away from restrictive levels. Given the amount of tightening and pace with which inflation has moved back towards central bank targets, we view the markets’ pricing as the potentially more correct interpretation of the current cash rate outlook. At some stage over the next 6–12 months, interest rate cuts may occur, and this should breathe new life into defensive and growth assets alike.
Conviction views on defensive assets
- Short-dated IG credit: Credit spreads remain at fair levels but inverse yield curves in many markets make longer-dated credit less attractive, leaving shorter-dated credit as our preference.
- Gold is still an attractive hedge: Gold has been resilient in the face of rising real yields and a strong US dollar, while proving to be an effective hedge against geopolitical risks and sticky inflation pressures.
- Attractive yields in EM: Real yields in this sector are generally very attractive and we prefer quality EM currencies against the backdrop of a generally weaker dollar.
Process
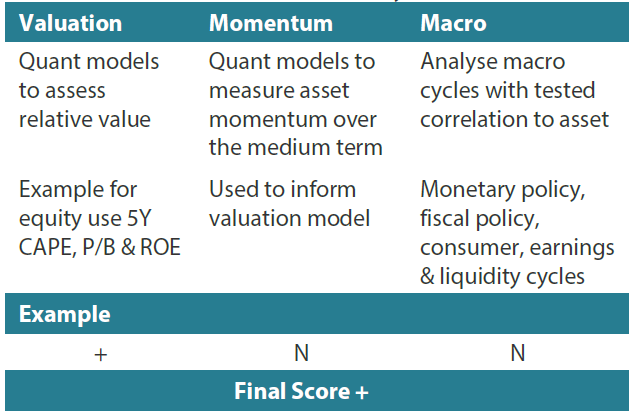
In-house research to understand the key drivers of return:
Any reference to a particular security is purely for illustrative purpose only and does not constitute a recommendation to buy, sell or hold any security. Nor should it be relied upon as financial advice in any way.


