Did policy factors contribute to the collapse of opportunities in equity markets?
For decades, the profit margins of S&P500 constituent firms have been expanding, driven by several factors. Two such factors, which persisted over decades across sectors, industries and firms of all sizes, were the steady march downward of interest and tax rates for the latter part of the last century and the beginning of this one. These factors were not the only contributors to the growth in profits; for example, the lion's share of profits that accrued to technology sector firms may have genuinely been rooted in innovative products and services.
That said, another phenomenon coincided with ever-easier policy: the homogenisation of returns across S&P constituents. Was policy in part responsible for this collapse in stock-selection opportunities (and as a result, increasing allocations to index-tracking investments)? If so, reaching the natural conclusion of increasingly accommodative fiscal and monetary policy could create new opportunities. Firms skilled at raising profitability in areas of core business competency could benefit, and thus create new opportunities for skilled investors to realise excess returns.
The "era" in question defined: the lazy policy push for profits
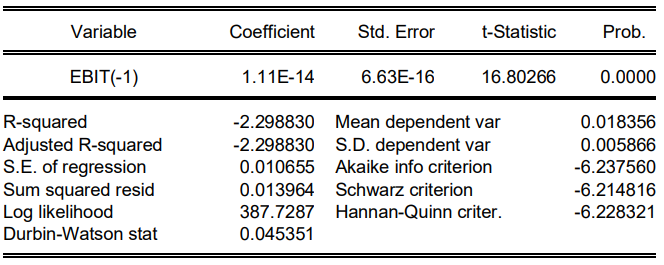
In a paper published by the Federal Reserve Board in 2023, Michael Smolyansky examines the contributions of decreases in effective tax rates and interest expenses to non-financial US corporates' increasing profits. In the 30 years to 2019, Smolyansky finds that these policy factors contributed to 40% of corporate profit growth. He concludes that the era of policy-driven corporate earnings growth—and therefore buoyant valuations and stock returns—is most likely behind us. Chart 2 illustrates the multi-year declining trends in both corporate taxes and interest rates (the latter relative to EBIT).
In counter-argument, some may point to the desire of the current US administration to further reduce corporate tax rates. But with the US debt-to-GDP near 120% by some measures (a post-World War II high), made even more exceptional by the fact that this high is being realised with the economy expanding at healthy rates of between 2-3%, it is difficult to envisage any marginal decrease in taxes, corporate or otherwise, that would not be at least partly offset by higher market interest rates than would be seen in a less indebted environment. Term premiums have been on the rise; as recent bond market gyrations show, even additional debt-funded tax cuts may not be able to boost profits if inflation expectations also increase, thereby eroding real after-tax income. If indeed our "new normal" is trending toward more inflation, the journey of US corporates on the "gravy train" of ever-easier policy is on borrowed time. However, does this necessarily herald the death knell of US corporate profitability?
Profits need not disappear: necessity is the mother of invention (or innovation)
It would be rational to expect firms that have dedicated outsize resources to lobby for ever-lower tax bills, as well as those dependent on ever-lower interest rates, to shift their business strategies. Of course, adaptation is risky and costly, and many firms may fail to thrive amid shifting macro-fundamentals, possibly leading to negative consequences at the firm level. However, it is not a given that the end of this particular era will be damaging for all companies, or indeed for long-term US productivity.
As Smolyansky highlights in his paper, the aggregate nature of benefits accruing to corporates from ever-lower tax and interest rates have artificially boosted aggregate earnings, with earnings growth driving a smaller proportion of corporate profitability than in periods of less substantial policy stimulus. However, by the same token, it is also important to recognise that these across-the-board aggregate profit-boosting factors may have also reduced many firms' incentives to distinguish themselves from their peers by boosting earnings. Innovating within their core competencies may have taken a backseat when coasting on policy stimulus was so much easier.
Beta fundamentals: importance of the aggregate when the average firm is not innovating
From the macroeconomic perspective, we might observe that total factor productivity (TFP) growth, which represents the residual of labour and capital contributions to production—and thus approximates technological innovation—has remained below 1% over the past decade (see Charts 1 and 2). Aggregates represent averages, and in this sense the average firm is not innovating much. Even though a select group of firms are investing in high-profile innovation areas within pockets of the economy (for example, in technology or technology-adjacent sectors), this is not widespread. The subdued growth in TFP indicates that despite the amount of capital invested into new technologies, such high-profile innovation is not yet an economy-wide phenomenon.
Chart 1: US TFP growth vs. EBIT growth (%, year-on-year)
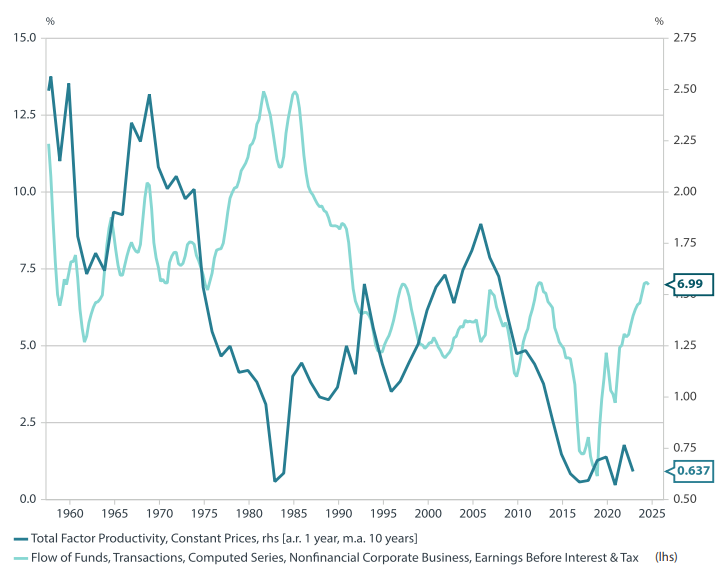
Source: Nikko AM, Fed, BEA, Long-Term Productivity Database
Chart 2: US corporate tax rate and interest paid/EBIT
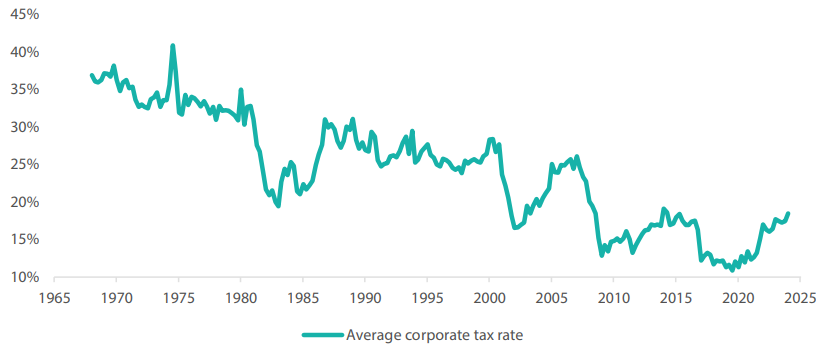
Source: Nikko AM, Federal Reserve, BEA
Investors sought beta and went passive when policy drove profits
The average firm is important as it may also represent a typical firm and a corporate security issuer. This is meaningful because, from a market perspective, investors opted to decrease their allocations chosen through active security selection. Such a stance not only implies that investors view the average firm as a representative, but that it may also be a response to the collapse in stock selection opportunities firm (see Chart 3 below). Investors may have concluded that it was not rewarding enough to invest in selecting firms with potential to outperform the average.
Chart 3: Dispersion of alpha has slumped since the start of the century
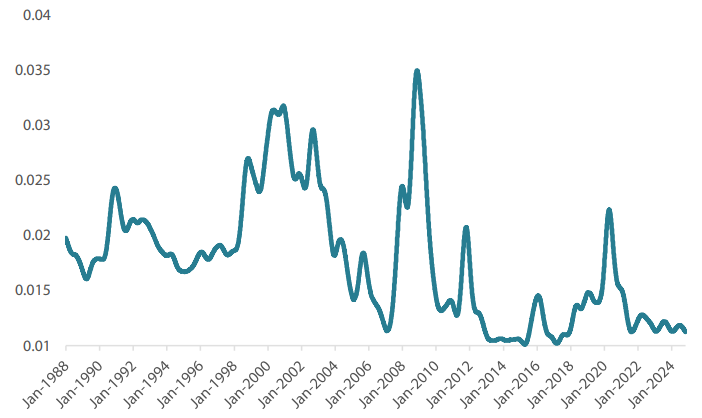
Source: Nikko AM, calculated based on historical data from Bloomberg
Meanwhile, as technology sector earnings gathered momentum, the financialization of larger-cap firms, especially technology firms (e.g. numerous large share buy-back programs), and a need to quickly deploy additional excess liquidity in search of positive returns, led to concentrated index returns in higher-margin large-cap US stocks. .
Chart 4: Allocations to active investments have been decreasing
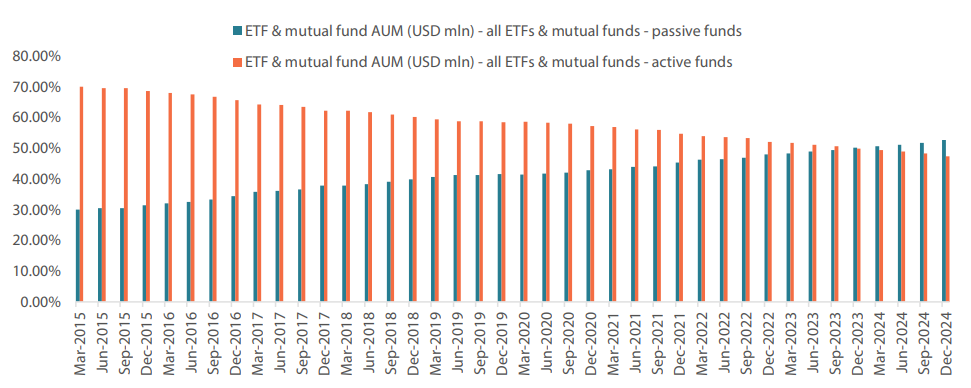
Source: Bloomberg
Only recently, allocations to active investments have come to represent the minority share of investments. As of June 2020, after several years of outflows from active investments into index-tracking vehicles, assets in actively managed mutual funds and ETFs accounted for 58% of the USD 19.1 trillion that fund managers reported to Bloomberg. By October 2023, the market had grown to USD 24.4 trillion, 50.5% of which was allocated to actively managed funds and 49.5% to passive funds. Immediately thereafter, passive funds surpassed active funds in assets under management and continued to gain greater market share. As of January 2025, active funds made up 47.3% of a USD 30.8 trillion market while passive funds accounted for 52.7%.
As opportunities were limited, the shift to passive funds was rational
Of course, the move towards increasingly concentrated passive index strategies predates the recent technology-driven concentration. As we have shown above, the 30 years leading up to 2019 were not only defined by ever-lower tax and interest costs for corporates (as Smolyansky observed), but also by a slump in opportunity for investors. This was only interrupted by the volatility the Global Financial Crisis (GFC) triggered (see Chart 3). The gradual migration from active security selection to passive investment may have been, for dearth of opportunity, rational.
GFC aside, a monumental slump in security selection opportunity
We measure the set of opportunities for security selection as follows: first, we select historical member securities in the S&P500 from 1989 through 2019 (re-weighted in 2009), weighting all securities by their maximum market weight. This gives an index with a 1-year weighted CAPM beta that is mostly stationary at around 1.0. We then use the rolling one-year variance of the residuals of market returns around the CAPM beta to represent the opportunity set. As we see, this measure of active investment opportunity, apart from a temporary surge around the GFC, has remained on a downtrend since the early 2000s, much like the smoothed measure of total factor productivity growth in Chart 1 above.
Policy factors may have contributed to the collapse in opportunity
The relationship between tax rates, interest cost, and investment opportunity is complex. Yet it may be intuitive to suggest that factors broadly affecting all firms—and therefore across-the-board earnings—were responsible for an outsized proportion of corporate profits and therefore decreased the idiosyncratic value proposition of firms. We use statistical analysis to test this hypothesis on whether the contribution of policy—interest expenses relative to EBIT and corporate tax rates—to earnings and alpha dispersion was merely coincidental.
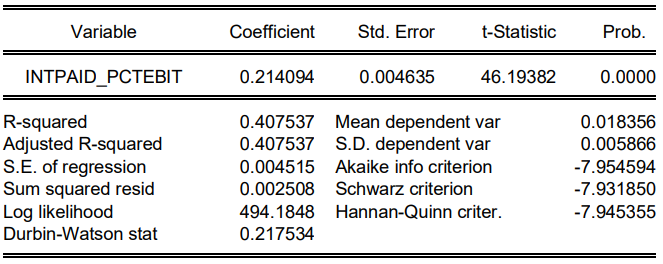
First, we examine the relationship between nonfinancial US firms' EBIT (from US flow of funds data, lagged one quarter) and the dispersion of alpha. We see a significant negative relationship between the two, suggesting that the steady rise in EBIT and the drop in our opportunity proxy are likely related, even if the relationship is not directly causal. Next, we examine the relationship between interest as a percentage of EBIT and alpha dispersion. We also find this relationship to be significant and positive—as interest rates declined, so did investment opportunities.
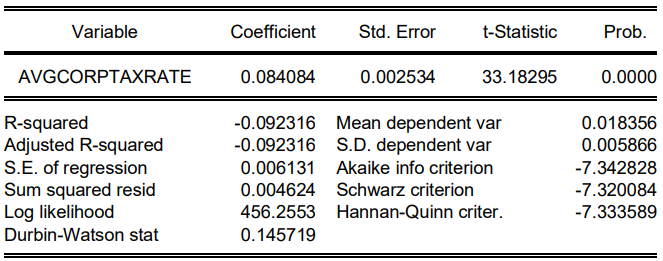
Finally, we regress the average corporate tax rate against our measure of opportunity and find another significant relationship, albeit not strongly contemporaneous or linear (see Appendices for regression results). Curiously, the significant linear relationship is negatively sloped – opportunity should usually increase when the tax rate decreases. However, over time, it is obvious that the decrease in corporate taxes was not consistent with an increase in opportunity over the long-term.
Thus, after testing for cointegration (a long-run relationship between two non-stationary variables), a cointegrating regression yields a positive, significant relationship between the corporate tax rate and security selection opportunity. Over the long run, as the corporate tax rate declined, there was an associated decline in the dispersion of alpha, indicating a decrease in active investment opportunity.
Conclusion: decrease in policy contribution to earnings may increase opportunities
If indeed the policy environment has been the rising tide that has lifted all boats in terms of EBIT and therefore stock returns, it may be easy to conclude that the end of this policy regime could herald darker days for the average firm. But that is not our main point; the average matters most to those who do not distinguish between firms that outperform the index and those that underperform.
As Jones and Wermers point out in their paper, "Active Management in Mostly Efficient Markets" (2011), skilled active managers tend to perform relatively better in environments with greater opportunities, i.e., periods that "offer more mispricing opportunities for managers to take advantage of their superior insights". Such periods of "higher return dispersion and volatility" can also offer greater opportunities. This suggests that a new era of opportunity may emerge even amidst index volatility, one in which firms can again distinguish themselves by their abilities to innovate and expand margins. In other words, the end of the current era might open a new door, one in which skilled stock pickers can identify the meaningful outperformers of the future.
Many thanks to Will Low of the Global Equity Team and Chris Rands of the Global Multi-Asset Team who reviewed earlier versions of this article.
APPENDIX: REGRESSION RESULTS
Decline in EBIT (lagged 1 quarter) and Alpha Dispersion - probably not random
Dependent Variable: ALPHA_DISP
Method: Least Squares
Date: 02/13/25 Time: 14:36
Sample: 1989Q1 2019Q4
Included observations: 124
Int Paid % of EBIT and Dispersion of Alpha
Dependent Variable: ALPHA_DISP
Method: Least Squares
Date: 02/04/25 Time: 13:51
Sample: 1989Q1 2019Q4
Included observations: 124
Average corp. tax rate and Dispersion of Alpha: significant, but maybe non-linear
Dependent Variable: ALPHA_DISP
Method: Least Squares
Date: 01/23/25 Time: 18:22
Sample: 1989Q1 2019Q4
Included observations: 124
Cointegrating regression: long-run relationship between tax rate & Alpha Dispersion
Dependent Variable: ALPHA_DISP
Method: Canonical Cointegrating Regression (CCR)
Date: 02/14/25 Time: 15:07
Sample: 1989Q1 2019Q4
Included observations: 124
Cointegrating equation deterministics: C
Long-run covariance estimate (Prewhitening with lags = 4 from AIC
maxlags = 4, Bartlett kernel, Newey-West fixed bandwidth = 5.0000)