On 13 August, the Global Investment Committee (GIC) held an extraordinary session to review the impact of recent volatile market movements, as well as the growing concerns over slower US growth. In summary, our conclusions were as follows:
- We maintain our central scenario for positive GDP growth in most major economies, although we see heightened downside risks to our US GDP growth outlook given recent softer-than-anticipated US data. We continue to anticipate range-bound inflation, with a gradual disinflationary trend in the US and Europe. Meanwhile, we expect reflation to continue in Japan and pick up in China.
- We continue to see the Federal Reserve (Fed) as likely to deliver at least one interest rate cut in 2024, which we believe will help growth remain positive. However, we also foresee higher risks of a more pronounced slowdown in growth; this, in turn, could contribute to higher risks of the Fed engaging in multiple rate cuts in 2024 and early 2025.
- We maintain our view that Japan’s “virtuous circle” of wages and prices will remain intact, with growth likely to remain above potential and inflation expected to surpass the Bank of Japan (BOJ)’s 2% target over the immediate horizon. The yen, meanwhile, recouped some of its earlier losses faster than we expected. Combined with our outlook for upcoming Fed rate cuts, the BOJ’s resolve to normalise policy (albeit gradually) is likely to keep the yen moderately supported. Indeed, versus the dollar, we do not foresee the yen spending time back above 150. This may, in turn, bring some temporary volatility that impacts equity valuations, which could create buying opportunities. Meanwhile, there is some risk that the yen’s reversal may have some second-round effects on corporate earnings, albeit with a lag.
- We expect US earnings growth to remain positive over our outlook period but maintain our more conservative earnings outlook versus consensus estimates. Moreover, we foresee limited upside in valuation (P/E), unlike in Japan where valuations are less rich.
Global macro: increased downside risks to US GDP growth outlook
New developments in US GDP growth and inflation since Q2: In the US, following several substantial downward revisions to past data, the July nonfarm payrolls came in significantly softer than expected. The US unemployment rate also rose to 4.3% (although, importantly, labour participation rose). The Sahm rule1 was triggered, and some market participants began to fear that a recession was imminent, giving rise to some calls for 50 basis point (bp) Fed rate cuts within 2024. June’s core CPI cooled further while US manufacturing activity contracted in July by the most in eight months, weighed by subdued orders and production in addition to the largest ISM employment drop in four years.
However, there were also caveats to the weak data. Although consumer sentiment remains soft, average weekly earnings continued to expand in June, as did retail sales. Meanwhile, despite the softer June CPI print, the Fed’s favoured core PCE indicator failed to decelerate as expected in June.
Additionally, in spite of disclaimers by the Bureau of Labor Statistics that the weather (hurricane Beryl) had “no discernible effect” on the weak nonfarm payroll figure, the data appear to indicate otherwise. Most of the layoffs were temporary (with permanent job losses little changed) and the decline in job losses in the establishment survey was concentrated in transit and ground passenger transportation sectors, which were likely to have been influenced by the weather.
Moreover, the increase in the US unemployment rate comes amid steady growth in the US labour force (thanks to immigration) and a steadily increasing labour participation rate. As such, this decrease does not owe purely to a deterioration in employment.
GIC perspective: slower but positive growth trajectory intact while volatility contributes to downside risks
With inflation, though showing some signals of slowing, still above the Fed’s 2% target, we were reluctant to react to one month of soft US data. Meanwhile, several Fed speakers have since tempered expectations for aggressive easing, including multiple 50-bp reductions or inter-meeting cuts.
That said, we note the reaction of financial markets to the softer data with the VIX spiking to highs above 60 as speculative “carry trades” were unwound. While we admit that it may be somewhat circular to reference financial market turbulence as a harbinger of slower growth, it is worth noting that financial markets have been great contributors to accommodative financial and monetary conditions.
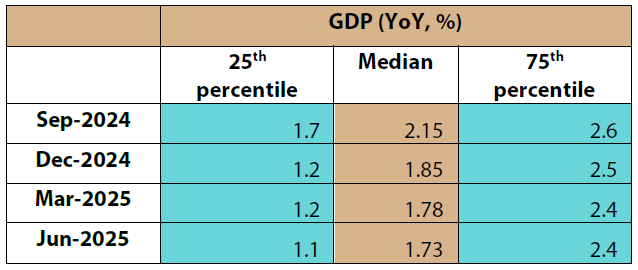
As such, we found it unwise to overlook downside risks to the economy should financial market volatility return and prove disruptive to growth. Therefore, we have downgraded our 25th percentile US growth estimates as outlined below, which also slightly impacts the median GIC estimates of US growth.
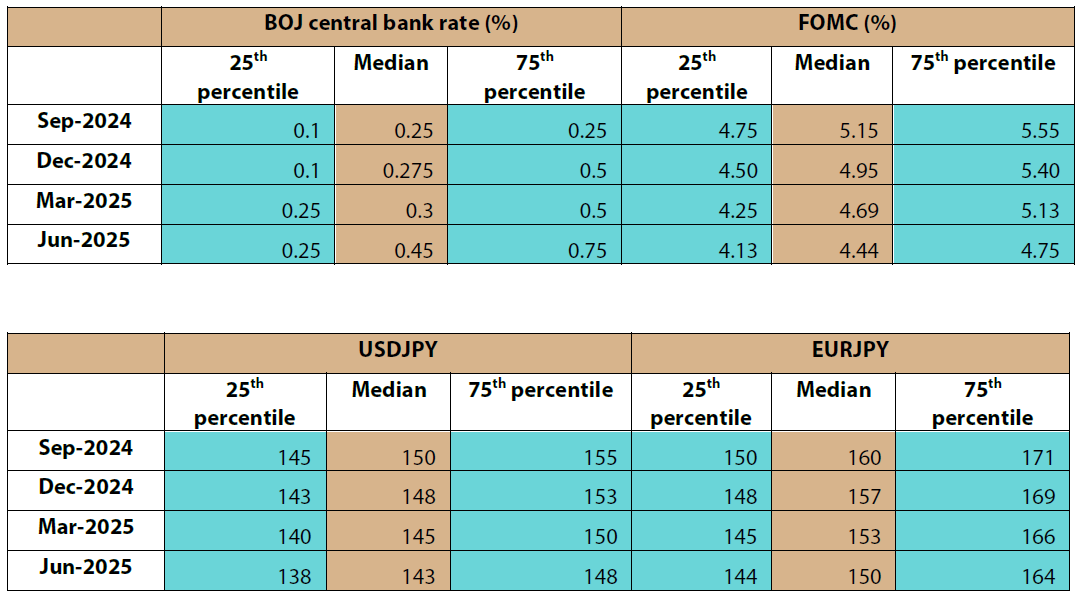
Central bank rates and forex: yen unlikely to revisit lows; downside risks to FOMC
New developments in central bank rates and forex since Q2: The BOJ surprised many market participants by hiking interest rates to 25 bps on 31 July. The BOJ’s statement signalled upside risks to prices and a modest upgrade to the upper end of longer-term core inflation within the quarterly Outlook for Economic Activity and Prices. The BOJ meeting was soon followed by the July FOMC and Chair Jerome Powell’s statement cemented expectations for a September rate cut. We should note that Powell, who signalled that a rate cut could come “as soon as” September, also did not rule out the possibility of “zero cuts” and indicated that any easing would depend on data.
Dollar/yen meanwhile showed somewhat of a muted reaction to the 31 July BOJ decision. The market was subdued until the 2 August release of the US July nonfarm payrolls, which surprised on the downside. Subsequently, the BOJ’s summary of opinions released on 8 August made a reference to a terminal interest rate of “at least” 1% (largely reflecting rising long-term inflation expectations) and was therefore perceived as hawkish. The US data disappointment combined with the BOJ’s perceived hawkish stance helped to trigger a succession of events in financial markets.
Large speculative yen shorts crumbled as US recession fears prompted some market speculation that the Fed was “behind the curve” or that the BOJ would engage in a series of rate hikes without ensuring that markets would successfully absorb them. Volatility has since abated somewhat, but what remains clear is that relative interest rate differentials (of late, real interest rate differentials) have been driving the carry trade. As a result, even a small narrowing of the spread caused leveraged players to bow out.
Subsequent to the resurgent market volatility, BOJ Deputy Governor Shinichi Uchida offered assurance that further rate hikes would not come amid unstable markets, and with many speculative yen shorts liquidated (at least, according to the IMM Commitment of Traders report), dollar/yen stabilised above the 145 level (modestly above Japanese corporates’ FY-end expectations per the BOJ’s July Tankan report).
That said, many current estimates of purchasing power parity puts 1 dollar at slightly less than 100 yen, which implies that “fair value” may exercise a downward pull on the currency pair given the outlook for gradually narrowing interest rate differentials.
GIC perspective: dollar/yen to remain range-bound with limited downside to Q2 2025
With speculative yen shorts apparently largely cleared after building up to multi-year highs, we feel that there is limited impetus for dollar/yen to resume its sharp drop in the near term. The BOJ has been duly warned by currency volatility and it has committed itself to making its next move in calmer markets. We maintain that BOJ policy, still accommodative by most measures, will likely tighten at some point.
However, we believe that there is sufficient reason for the BOJ to continue to gauge not only data (which has been positive of late, such as buoyant private demand-fuelled Q2 GDP growth and positive June real wage growth) but also overseas data and financial market conditions. We therefore maintain our BOJ outlook (we had foreseen one rate hike from the BOJ sometime between July and September) although we modestly downgraded our dollar/yen and euro/yen guidance ranges. Meanwhile, the heightened downside risks that we see to US GDP growth also correspond to higher downside risks to Fed policy rates, as follows:
Japan equities: volatility, dollar yen impact temporary but non-negligible
New developments in Japanese equities since Q2: As the market re-rated the “carry trade”, the CBOE VIX index (a proxy for equity market risk over the next 30 days) spiked on 5 August to above 60 from below 20, after which volatility has slowly abated. The Nikkei 225, which is price-weighted and therefore volatile, saw three-month at-the-money implied volatilities (a slightly longer horizon measure than the VIX) surge above 37 on 5 August before slowly pulling back. The TOPIX, typically less volatile, also saw three-month at-the-money implied volatilities spike near 30 and then ease somewhat.
Japanese stocks were oversold (with TOPIX price/earnings ratios sinking to the mid-11 handle), and the decline became a good opportunity for companies to buy back shares and institutional investors to accumulate stock. The TOPIX index subsequently staged a comeback, with price/earnings recovering to 15.
Early observations by sector: Financials and trading company stocks were the hardest hit amid the sell-off but domestic demand and defensive names (e.g. medical equipment) remained more resilient. Similarly, many cash-rich stocks, as well as firms investing in human capital and consequently experiencing increased productivity, have also remained robust. Meanwhile, the sell-off significantly affected semiconductor and auto stocks. The sell-off may have undervalued high dividend yield names, which could be poised for an eventual comeback.
GIC perspective: With volatility still higher than before the recent market shock, the rebound by Japanese stocks appears to be limited below prior highs. That said, earnings in the first quarter of Japan’s current fiscal year (FY24) appear solid so far. Signals of domestic demand, including both consumption and investment, becoming a stronger driver of growth continue to support Japan’s “virtuous circle”. Firms appear to retain pricing power even as real wage growth has turned positive. The outlook appears structurally sound for the longer-term, though near-term, we suspect that the impact of stock volatility as well as a stronger yen (which would impact firms with significant overseas revenue) may exercise an interim drag on earnings in some sectors. Although we remain positive on earnings growth overall, it is possible that we may see some sector rotation, allowing for domestic demand sensitive firms that have underperformed to date to catch up with those more driven by overseas revenues.
We continue to expect Japanese corporates to generate healthy single-digit earnings growth across the TOPIX, which represents the majority of our Japan equity investments. However, we foresee valuations being affected by potential ripple effects from the recent market volatility and carry trade unwinding. We estimate that the impact may last for three to six months. Additionally, there is a risk that a weaker dollar/yen could, with a lag, exert a downward pull on the earnings of large cap exporters with overseas revenues, particularly among Nikkei constituents.
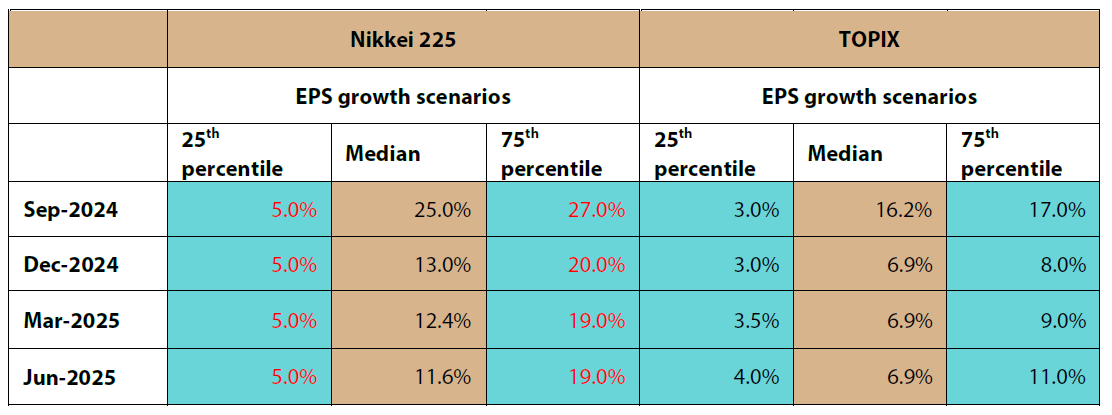
Although we remain firm in our conviction that Japan’s structural recovery is likely to continue supporting Japanese equities, we acknowledge the possibility for an interim resurgence in equity volatility. The GIC is shifting from single valuation assumptions (P/E) in Japanese stocks to a guidance range for P/E. This is similar to our guidance range for earnings per share (EPS) guidance, with which we aim to capture probabilities between the 25th and 75th percentiles of consolidated earnings growth. We are also making modest adjustments to our EPS guidance ranges and adding 25th and 75th percentile indicators for Nikkei-listed large-caps.
Earnings guidance ranges: We foresee year-on-year (YoY) earnings growth for the TOPIX ranging between 3% and 8% YoY (excluding base effects adjustments) over the second half of 2024. We expect earnings growth to recover to between 4% and 11% in the first half of 2025, once near-term volatility abates and companies have adjusted to a mildly stronger yen. We foresee the Nikkei’s earnings range between 5% and 20% YoY for H2 2024 (excluding base effects adjustments) and between 5% and 19% over the first half of 2025, with a more lasting impact likely to be felt among large exporters and firms reliant on substantial overseas revenue. In the near-term, we anticipate an adjustment in YoY EPS growth in September, due mostly to the low base effects of September 2023’s EPS. We believe that in the September quarter of 2024 there will be a one-off adjustment in YoY EPS growth terms in order for annual EPS to be kept on a gradually increasing trajectory.
EPS growth guidance
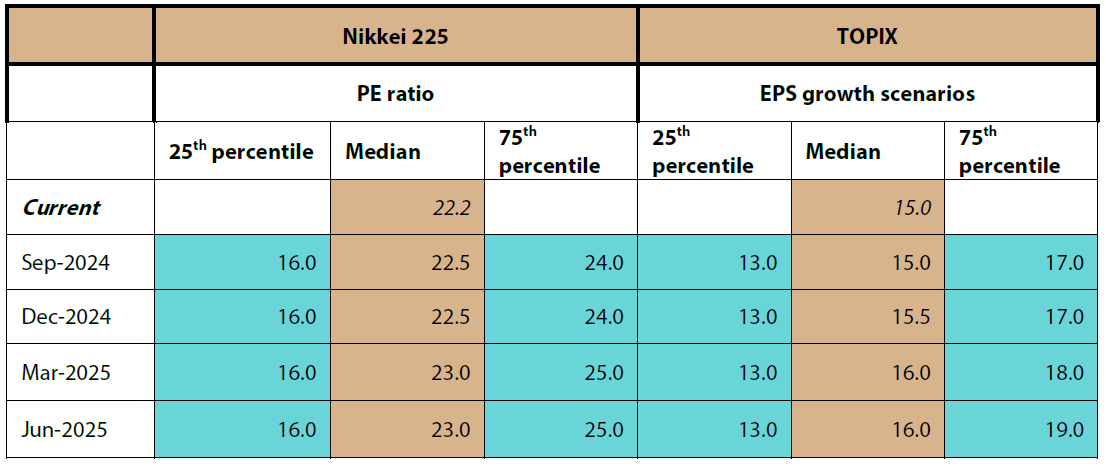
Valuation ranges: We expect price/earnings to show greater fluctuations than what we have observed very recently. This is due to the market appearing more vulnerable to swings as uncertainty over economic growth impacts markets. We are therefore expanding our P/E estimates from single assumptions to a range, estimating outcomes between the 25th to 75th percentile. We expect the Nikkei’s P/E range to fluctuate between 16 and 24 in H2 2024, followed by a range of between 16 and 25 in H1 2025. We anticipate an upward bias over time given ongoing structural transformation among Japan’s corporates, led by large caps. For the TOPIX, we foresee a range of 13-17x in H2 2024 and 13-19x in H1 2025, with a similar upward trend over time.
P/E ratio guidance
Implied price (indicative only): price trends to be driven by EPS and higher valuation over time
As we noted in our Q2 GIC Outlook, we have made changes to the GIC process. This includes more closely aligning our Outlook with the views underlying our portfolio investments and therefore providing indicative guidance ranges as opposed to point forecasts of index prices for indicators and indices. As a result, we have shifted to guidance centred on variables that are of interest to us as investors, including earnings growth and valuation. For the convenience of our readership, we calculate indicative prices as implied by our EPS growth (using Bloomberg’s “BEst" Earnings estimates of realised earnings per share for the base year) and price/earnings guidance ranges, for reference purposes only. Based on the guidance provided above, the implied index prices are as follows:
Implied price (using 2023-2024 BEst EPS as base)
The lows within the range represent the lower end of our anticipated price fluctuations, which takes into account the combined effect of earnings impact and valuation shifts. The highs within the range represent the upper end of our anticipated price fluctuations.
A note on changes to the Global Investment
Committee Process: In June 2024, we made changes to
the Global Investment Committee, as to align our quarterly Outlook more closely with the views underlying
our portfolio investments. In lieu of forecasts, we have chosen to provide guidance ranges for indicators and
indices that we feel most closely relate to the asset classes we manage. In place of forecasts the Global Investment Committee now provide aggregate guidance at the median for our central outlook, and at the 25th and 75th percentiles.
The asset classes represented in our Outlook can change over time, depending on what is most representative of our active investment views.
In the event full ranges are not available, this may be interpreted as to mean that the asset class is not a central focal point for our highest conviction investment views.
The GIC’s guidance ranges may be found in Appendix 1 of this document.
Appendix 1: GIC outlook guidance revisions
Global macro
Central bank rates, forex, fixed income and commodities
Equities
1 The Sahm rule is a heuristic measure of determining whether the economy has entered a recession using unemployment relative to recent history. The Sahm rule compares the three-month moving average of the national unemployment rate to its low over the prior twelve months (with an indicative threshold of 0.5% above the prior 12-month low).