 Source: Alamy
For the last two centuries energy revolutions have created extensive platforms for subsequent technologies to drive wealth creation and raise living standards across the world. Because of this each citizen on earth has the equivalent of 60 people working day and night on their behalf. In rich developed countries the average rises to above 200. Cheap energy has amplified our ability to achieve things in the material world.
The picture above comes from a small, Orthodox chapel in Lockerbie about 70 miles (112 kilometres) from Glasgow. Lockerbie is one of Scotland’s many market towns built on the growth of agriculture. It was coal, or more precisely the steam engine and the railways, that led to a massive growth in the town’s population in the mid-19th century— connecting the great industrial cities of the era, such as Glasgow or London, allowing market produce to move quickly to the consumer. A sort of Amazon Prime of its day!
A century later Lockerbie had lost its charm as another energy revolution, this time oil, meant cars could travel long distances and the need to break a long journey no longer existed. The M74 motorway, built in the 1960s, bypasses the Lockerbie town centre—so why bother stopping?
UndiscoveredScotland.com, suggests the above chapel is a reason to stop. It was originally a prisoner of war camp for Ukrainians after WW2, who turned it into a place of worship in May 1947. The prisoners had been supporting Nazi Germany as a way of fighting involuntary occupation by a Russia-dominated Soviet Union led by Joseph Stalin. Their hatred of the Russians came from the Great Terror Famine of 1932–1933 (the Holodomor), during which Stalin is estimated to have starved three to four million Ukrainians to death in an effort to purge their nationalism, take ownership of valuable commodities and finance his regime of terror. Using energy and food as a tool of war is not new for Russia. Today, Lockerbie is again accepting Ukrainians. What is different this time is Russia has just lit the touch paper for the next energy revolution.
Energy transitions take time
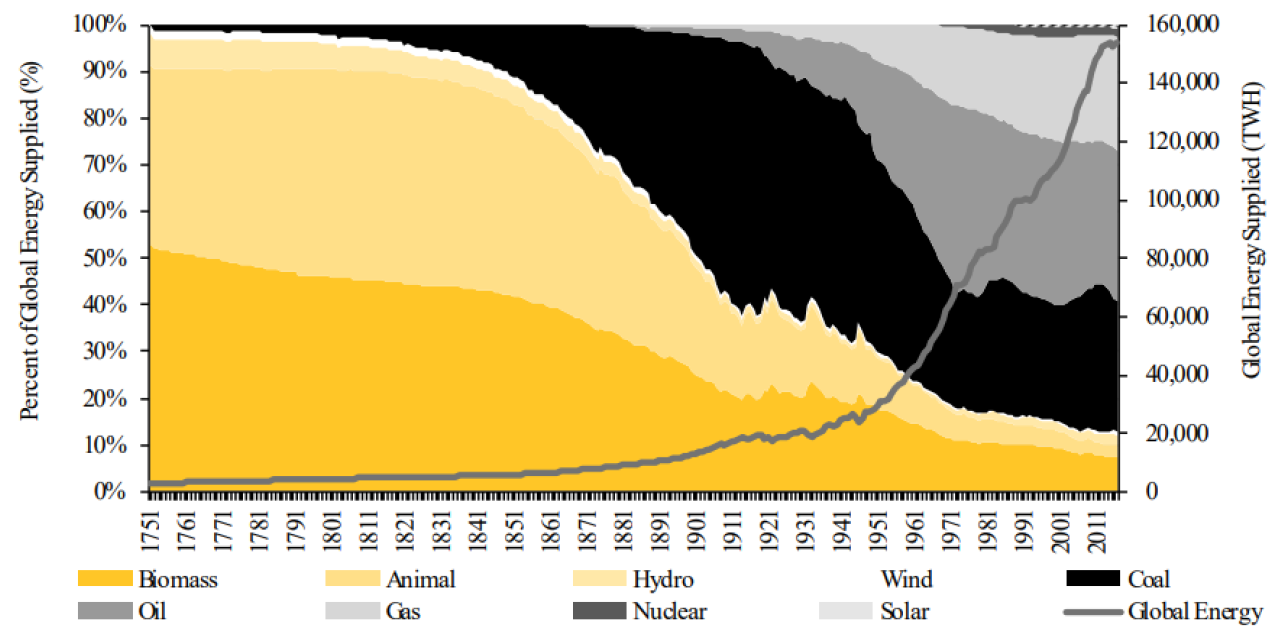
The first modern day energy revolution in the early 19th century, from wood to coal, fuelled great innovation that helped power the first railroads and oceangoing ships. The second happened about 50 years later in the 1880s, with the introduction of widespread electricity which led to inventions such as electric elevators, refrigerators and the mechanisation of agriculture. The third energy revolution was of course refined oil, which by the late 1920s dominated the transport sector and reached a high point as a percentage share of all energy by 1973. Each needed massive infrastructure spend before the benefits from adjacent technologies could be realised. These were “system” changes, fighting incumbents and vested interests and on average took 50 years before reaching maturation. Energy transitions take a long time.
Chart 1: Transitions take time
 Source: BP (2017); Carbon Dioxide Information Analysis Center; Smil (2016a, 2017); authors’ estimates
The clean energy transition will be no different and the scale of the infrastructure spend for this new system is enormous. Per the recent Intergovernmental Panel on Climate Change (IPCC) report “The Mitigation of Climate Change”, emissions in 2019 were 19% higher than originally thought1, meaning the challenge we face is greater than we fear. The world has emitted 2,400 gigatonnes of carbon dioxide (GtCO2) since 1850, 40% of which in the last 30 years. To achieve the 1.5 degrees Celsius target by 2050, the world has a remaining “CO2 budget”, the allowable amount of additional emissions, of 500 Gt. For comparison we emitted 400 Gt in the last decade and despite lower energy intensity in developed countries, emissions are not going down. At this rate we have 12 years left before the budget is done.
1 IPCC, 2022: Climate Change 2022: Mitigation of Climate Change. Contribution of Working Group III to the Sixth Assessment Report of the Intergovernmental Panel on Climate Change [P.R. Shukla, J. Skea, R. Slade, A. Al Khourdajie, R. van Diemen, D. McCollum, M. Pathak, S. Some, P. Vyas, R. Fradera, M. Belkacemi, A. Hasija, G. Lisboa, S. Luz, J. Malley, (eds.)]. Cambridge University Press, Cambridge, UK and New York, NY, USA. doi: 10.1017/9781009157926
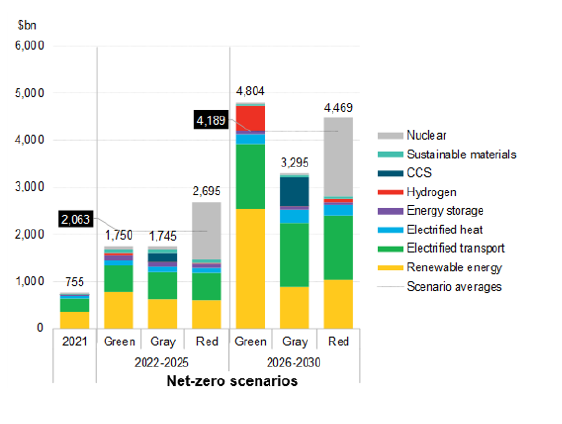
The scale of the investment is enormous. IPCC estimates the required annual spend to be between USD1–4 trillion by 2050—however, given the very nature of what we are trying to achieve, this spend will need to be front end loaded. Our current spend is approximately USD 750 billion. We are woefully underspending.
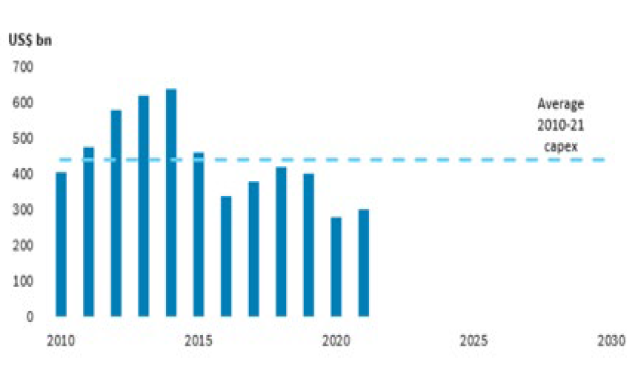
What makes this job even harder is that we have been underspending in traditional energy too. Energy companies have received a tidal wave of negativity—from investors excluding the sector on the grounds that all fossil fuels are bad; proponents of ESG across the capital structure have been putting pressure on management to lower their carbon footprint, decarbonise their scope 1 & 2 emissions and set net zero 2050 goals while also improving returns. Unsurprisingly, management teams have held a tight grip on the purse over the past 6 years—with consequences that are currently playing out.
| Chart 2: Energy-Upstream capex.. | and transition spend (USD billion) | |
|
|
Between under-investing in the existing energy systems and not yet investing anywhere near what is required for decarbonising the planet, we estimate the total under-spend across all energy systems could be in the region of USD 350 billion p.a. and rising. The Russia-Ukraine War makes things worse and there are no easy solutions. Immediate populist calls for more renewables are fine, but nearly all of the options have significant cost and even if we could ramp up renewable supply it would be at least two years before we would be net energy positive. The simple uncomfortable truth is that these options require heavy investment in terms of money and energy.
You cannot solve an energy shortage with promises. We believe that demand reductions and greater efficiencies out of existing fuels are the only short-term measures available to us. Spiking prices and volatility are the market’s way of prompting us to look for solutions and it looks like inequality will get worse as rising food and energy prices hurt the poorest most.
Lessons from the 1970s: Why let a good crisis go to waste?
The war in Ukraine will have long term implications for global energy markets and a quick review of the 1973 oil price shock provides some guidance on what we should expect.
The oil shock of 1973 was a response by OPEC countries to US aid provided to Israel during the Yom Kippur War. Oil prices rose almost five times in nominal terms between September 1973 and January 1974. The period is characterised by energy rationing and long queues at gas stations across most developed economies. Food prices also rose significantly -approximately 70% - and inflation was high. The similarities to today are obvious.
Faced with energy shortages, high inflation and foreign wars, politicians introduced a number of policies, some of which had long term positive impact. Others distorted the market or had unintended consequences.
The US introduced the Energy Policy & Conservation Act in 1975, which introduced the Corporate Average Fuel Economy (CAFE) standards, helping move US consumers away from large gas guzzlers, which at the time averaged 13 miles per gallon (mpg) or 20.8 kilometres, to smaller, more compact and efficient cars which achieved 20 mpg by the end of the decade. The largest beneficiary was the Japanese auto industry, which saw its US market share rise from 9% in 1976 to over 20% by 1980. Other policies included incentives to move the power sector away from oil-fired to coal-fired generation - which obviously had disastrous environmental impacts thereafter – while the move to biofuels kicked off too.
Other nations made significant changes too. Japan, as largely an importer of energy, refocused on efficiency and nuclear. France also focused on nuclear and to this day, nuclear remains the largest source of power for them. Denmark – yes, a relative minnow - decided not to pursue the nuclear option and instead raised gasoline taxes, improved efficiencies and reinvested the gains into the renewable sectors such as wind - an industry it dominates today.
Of course, the environmental problem we face today was not as well understood or recognised. Some nations took the opportunity to increase supply by tapping the North Sea, Gulf of Mexico and oil sands in places like Canada. Gas also accelerated in its mix and will continue to rise. Other consumer nations subsidised fuel, which had the impact of suppressing the impact but in doing so limiting efficiency measures and consequently long-term benefits.
The main difference between today and the 1970s is the breadth of shortages across all energy and power sectors today. Substitution will be difficult and energy intensity of developed nations is lower today - which may also make lowering energy use more difficult. Finally, many countries already have heavy subsidies or tax breaks that could hinder the long-term efficiency gains that are so badly needed.
The energy broadband infrastructure boom is upon us
Perhaps the hardest decisions for politicians in the coming months will be the apparent conflict between securing cheap food and energy versus a requirement to accelerate the energy transition. If these come into conflict—as appears likely—then we should expect the climate to lose out. But there are reasons to be hopeful that a more balanced approach to policy making—a “just” transition that meets all energy goals of security, affordability and the climate— can be met.
Here’s the positive pitch:
- 1. Demand for change is not the problem. Company management teams are already committing to net zero targets, some even backing science based targets, including scope 3 emissions. This merely reflects the wishes of their stakeholders, who themselves, as consumers, are voting for change with their wallets.
- Politicians, although not yet fully following through with their COP26 pledges, also understand the need for change and are introducing policies to help encourage the clean energy transition. The Green Deal, Sustainable Finance Disclosures Regulation (SFDR), EU Taxonomy and the Carbon Border Adjustment Tax are just a few examples from Europe.
- Finally, cost is often seen as a barrier. But a recent study reviewing more than 50 new energy technologies concluded that a rapid clean energy transition will provide the infrastructure required for new technologies to accelerate value versus the status quo.
We need to double down on our climate ambitions by investing in transition fuels such as natural gas given it is almost 60% less dirty than coal and where technologies already exist to eliminate methane leaks. European policy makers have already recognised the need for this, by accepting natural gas and nuclear as transition fuels within their proposed Taxonomy regulations. We can help mitigate energy price volatility by avoiding the premature closure of existing energy assets such as nuclear power stations; we can stockpile and store reserves; incentivise localised, clean and efficient alternatives such as heat pumps and renewables; and investors should engage with all management teams, especially those in the energy sector, to make sure the allocation of capital is appropriate for a world in transition.
The broadband spending of the late 1990s delivered the infrastructure needed for many of today’s wonderful technologies. Without it there would be no iPhone; no food delivery app; no streaming of music; no memes (good?); no Zoom. This decade heralds the start of an energy revolution providing investors, such as us, with lots of opportunities—the beginning of an energy broadband infrastructure boom.
What does it mean for Future Quality investing?
First what it doesn’t mean. We will not invest in commodity companies without pricing power and an obvious bridge to sustaining high returns. We will also not invest in companies who will either have their returns capped by regulation, such as utilities, or those who we deem are susceptible to a windfall tax, such as many energy companies today.
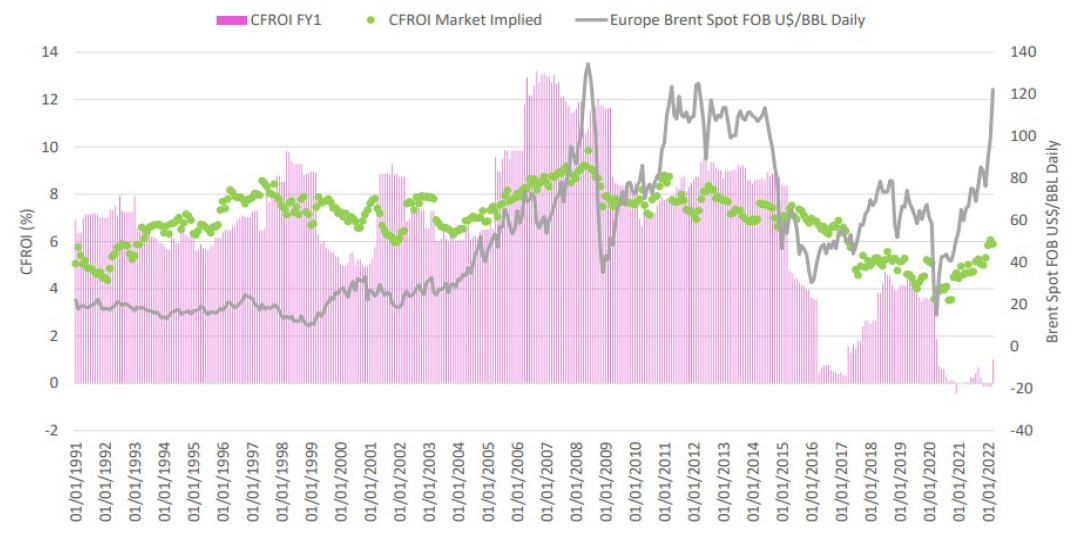
The return structure for the energy sector as a whole has never reached a level high enough to become Future Quality. If you dig a little deeper, the energy services sub-industry has fared better, achieving double digit returns, which we expect is likely to happen again as the best management teams have already pivoted their businesses to include clean energy services and can mop up significant growth in a hollowed-out industry with little competition.
Worley is an example of this. They are a leader in engineering services across the energy and chemicals industries and have targeted over 75% of their business to provide sustainable solutions in the next five years. These services are growing at double digit and not surprisingly are at higher margins to the traditional business.
Chart 3: Energy services cash flow return on investment (CFROI) Vs Brent
 Source: CSFB Holt
Reference to individual stocks is for illustration purpose only and does not guarantee their continued inclusion in the strategy’s portfolio, nor constitute a recommendation to buy or sell.
Outside energy and across the industrial and materials sectors there are many companies with niche solutions and technologies that will help industry decarbonise and become more efficient. For example, the leader in methane detection and leak prevention is Emerson. They are also leaders in the provision of compressors used in LNG plants and with 25% of their revenue exposed to energy companies, will benefit from the increased spending from that client base.
It is likely, in today’s geopolitical climate, that natural gas will retain its title as the transition fuel required for an orderly clean energy transition. Suppliers into the storage and transport of gas should do well, especially if their solutions are transition ready, such as those provided by Linde. Their solutions can be molecule agnostic and hence ready for a hydrogen future when that finally arrives.
KBR is also held in the portfolio. Their Sustainable Technology Solutions division owns a unique technology that aids the synthesis processing of ammonia from natural gas. Green ammonia will be a key component for storing and transporting hydrogen in a decarbonised world.
The portfolio also holds companies that specialise in energy efficiency, especially around the built environment, which accounts for close to 30% of the world’s carbon footprint. Solutions including management systems and carbon footprint assessments are provided by global sustainability leader Schneider, and energy efficient built exteriors such as roofing are supplied by Carlisle Companies.
Finally, the renewables space is highly competitive and currently fraught with supply chain and logistical issues, which is impacting margins for many companies. However, our investment in SolarEdge, the global leader in invertors for solar systems has been a top performing holding since we first invested in May 2020.
Postscript
Lockerbie has ridden the energy revolution waves over the years—some good, some bad. But what goes around comes around and the town is now the location for one of the UK’s largest biomass production sites, taking agricultural waste products and making clean energy. Perhaps the energy transition will be kind for a small town known globally for all the wrong reasons.
Reference to individual stocks is for illustration purpose only and does not guarantee their continued inclusion in the strategy’s portfolio, nor constitute a recommendation to buy or sell.
Strong ESG credentials
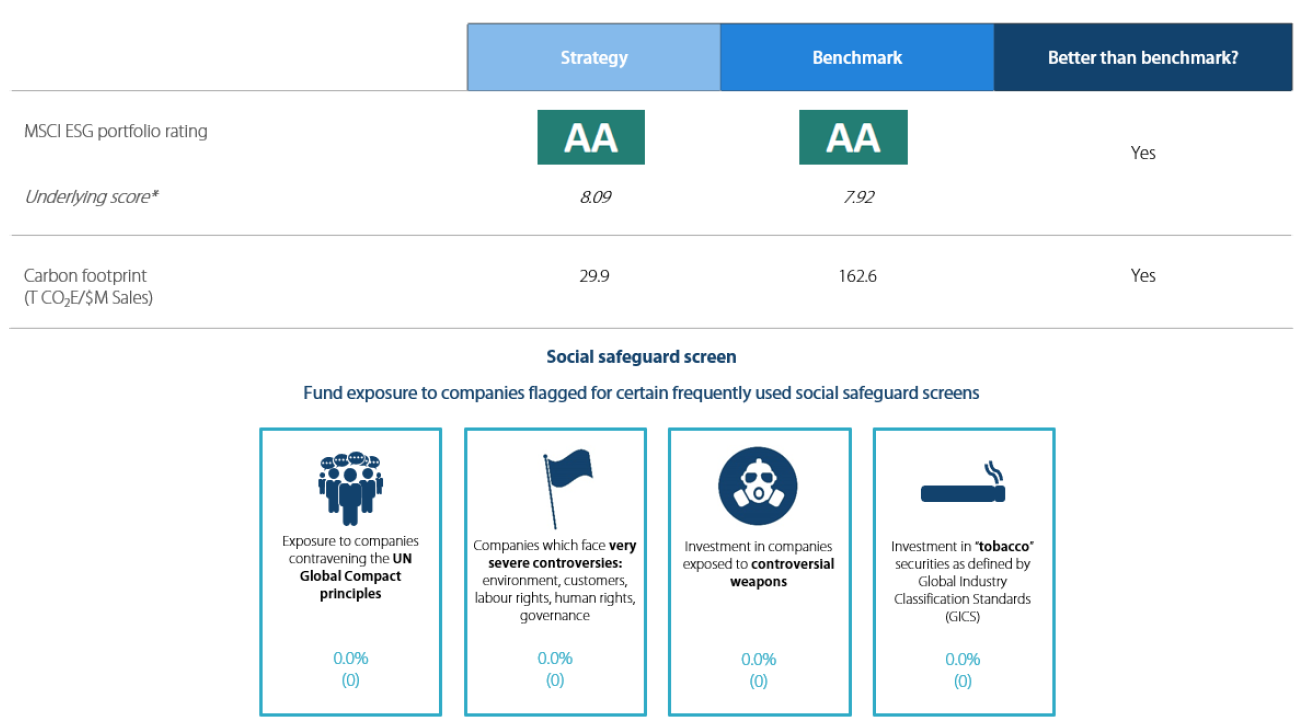
* Underlying score is the MSCI ESG Quality Score, Carbon Footprint is Weighted Average Carbon Intensity Data supplied as per the MSCI definitions. Fund is a representative account of the Nikko AM Global Equity Strategy. Any comparison to a reference index or benchmark may have material inherent limitations and therefore should not be relied upon. Benchmark is the MSCI ACWI.
Source: MSCI ESG Research March 2022Global Equity Strategy Composite Performance to April 2022
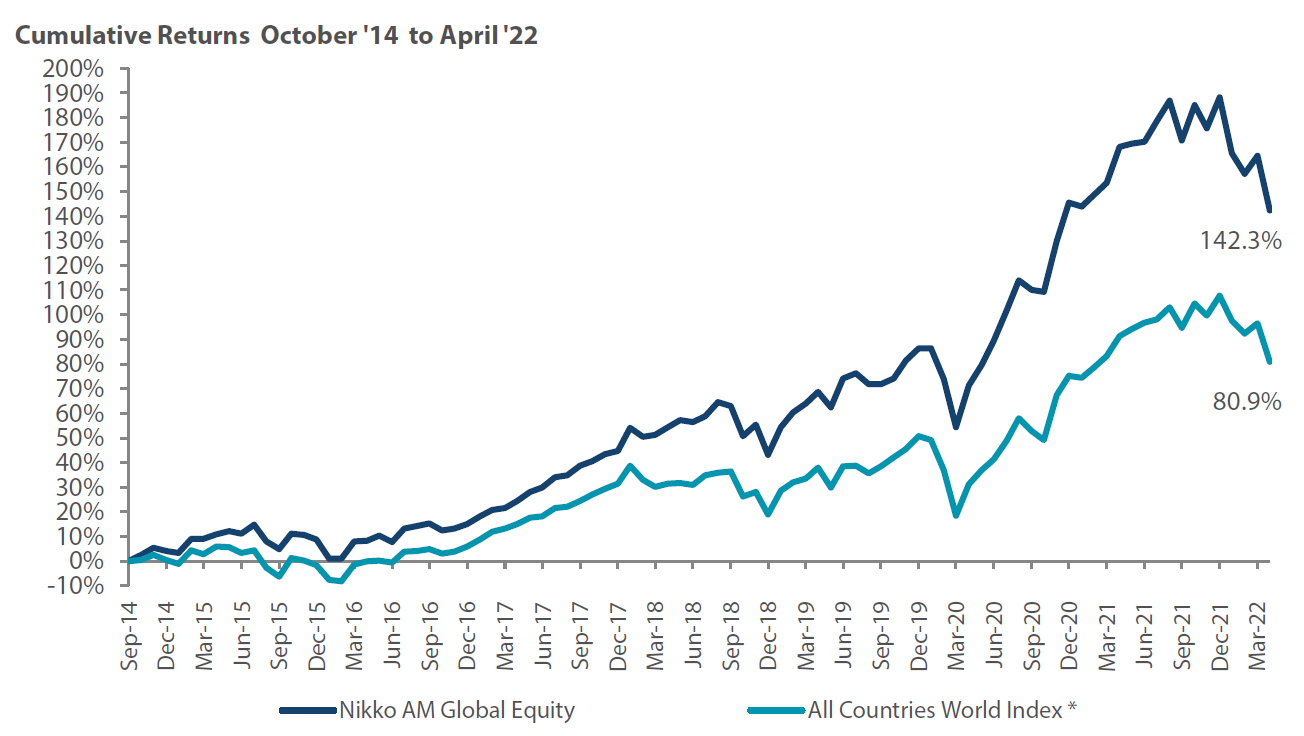

*The benchmark for this composite is MSCI All Countries World Index. The benchmark was the MSCI All Countries World Index ex AU since inception of the composite to 31 March 2016. Inception date for the composite is 01 October 2014. Returns are based on Nikko AM’s (hereafter referred to as the “Firm”) Global Equity Strategy Composite returns. Returns for periods in excess of 1 year are annualised. The Firm claims compliance with the Global Investment Performance Standards (GIPS ®) and has prepared and presented this report in compliance with the GIPS. GIPS® is a registered trademark of CFA Institute. CFA Institute does not endorse or promote this organization, nor does it warrant the accuracy or quality of the content contained herein. Returns are US Dollar based and are calculated gross of advisory and management fees, custodial fees and withholding taxes, but are net of transaction costs and include reinvestment of dividends and interest. Copyright © MSCI Inc. The copyright and intellectual rights to the index displayed above are the sole property of the index provider. Any comparison to reference index or benchmark may have material inherent limitations and therefore should not be relied upon. To obtain a GIPS Composite Report, please contact This email address is being protected from spambots. You need JavaScript enabled to view it.. Data as of 30 April 2022.
Nikko AM Global Equity: Capability profile and available funds (as of April 2022)
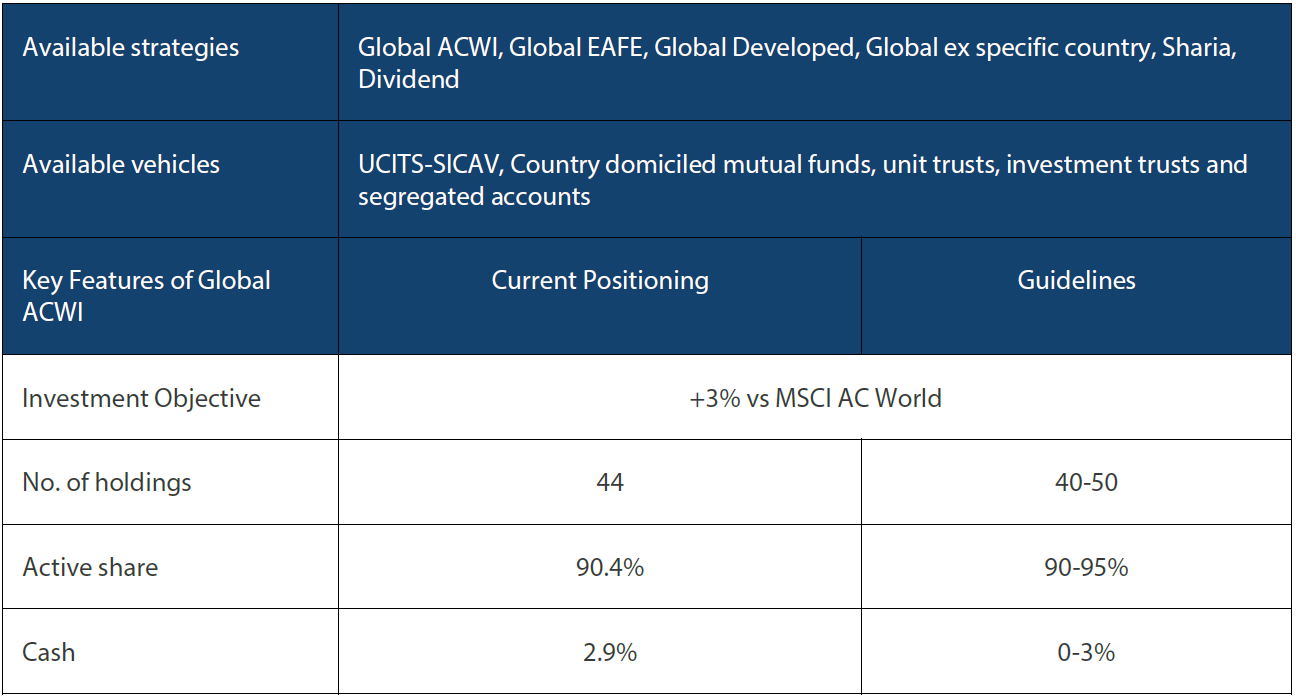
Target return is an expected level of return based on certain assumptions and/or simulations taking into account the strategy’s risk components. There can be no assurance that any stated investment objective, including target return, will be achieved and therefore should not be relied upon. Any comparison to a reference index or benchmark may have material inherent limitations and therefore should not be relied upon.
Past performance is not indicative of future performance. This is provided as supplementary information to the performance reports prepared and presented in compliance with the Global Investment Performance Standards (GIPS®). GIPS® is a registered trademark of CFA Institute. Nikko AM Representative Global Equity account. Source: Nikko AM, FactSet.
Nikko AM Global Equity Team

This Edinburgh based team provides solutions for clients seeking global exposure. Their unique approach, a combination of Experience, Future Quality and Execution, means they are continually “joining the dots” across geographies, sectors and companies, to find the opportunities that others simply don’t see.
Experience
Our five portfolio managers have an average of 25 years’ industry experience and have worked together as a Global Equity team for eight years. In 2019, two portfolio analysts, Michael Chen and Ellie Stephenson joined the team and they are the first in a new generation of talent on the path to becoming portfolio managers. The team’s deliberate flat structure fosters individual accountability and collective responsibility. It is designed to take advantage of the diversity of backgrounds and areas of specialisation to ensure the team can find the investment opportunities others don’t.
Future Quality
The team’s philosophy is based on the belief that investing in a portfolio of Future Quality companies will lead to outperformance over the long term. They define Future Quality as a business that can generate sustained growth in cash flow and improving returns on investment. They believe the rewards are greatest where these qualities are sustainable and the valuation is attractive. This concept underpins everything the team does.
Execution
Effective execution is essential to fully harness Future Quality ideas in portfolios. We combine a differentiated process with a highly collaborative culture to achieve our goal: high conviction portfolios delivering the best outcome for clients. It is this combination of extensive experience, Future Quality style and effective execution that offers a compelling and differentiated outcome for our clients.
About Nikko Asset Management
With USD 282.5 billion* under management, Nikko Asset Management is one of Asia’s largest asset managers, providing high-conviction, active fund management across a range of Equity, Fixed Income, Multi-Asset and Alternative strategies. In addition, its complementary range of passive strategies covers more than 20 indices and includes some of Asia’s largest exchange-traded funds (ETFs).
*Consolidated assets under management and sub-advisory of Nikko Asset Management and its subsidiaries as of 31 December 2021.
Risks
Emerging markets risk - the risk arising from political and institutional factors which make investments in emerging markets less liquid and subject to potential difficulties in dealing, settlement, accounting and custody.
Currency risk - this exists when the strategy invests in assets denominated in a different currency. A devaluation of the asset's currency relative to the currency of the Sub-Fund will lead to a reduction in the value of the strategy.
Operational risk - due to issues such as natural disasters, technical problems and fraud.
Liquidity risk - investments that could have a lower level of liquidity due to (extreme) market conditions or issuer-specific factors and or large redemptions of shareholders. Liquidity risk is the risk that a position in the portfolio cannot be sold, liquidated or closed at limited cost in an adequately short time frame as required to meet liabilities of the Strategy.


