In a transitioning and transforming world, change truly is the only constant. However, change can bring both opportunity and threat. How we respond to these changes as investors is clearly crucial to our long-term success.
Q1: Does the AI investment theme still offer significant long-term potential?
When we are confronted with truly significant change, we can often react in ways that are not entirely rational. If the change represents a perceived threat, our fight or flight response can be triggered, leading us to resist the change or ignore it in the hope that it might go away. While there are clearly risks, resisting the opportunities presented by artificial intelligence (AI) and ignoring its development would seem to be dangerous for investors.
Bill Gates has been quoted as saying that the impact of new technologies is often overestimated on a two year view but greatly underestimated over time periods of ten years or more. When we view technological development in its long-term context, the change it represents can become less overwhelming and we can see patterns from history which might give us a clue as to where we stand today, what might happen next and who the big winners might be.
It should be fairly obvious to investors today that we are in the middle of a very strong, AI-driven cycle for IT hardware as the infrastructure for an AI based platform of computing is being developed at a rapid pace. Yet, obvious questions remain, such as “how long will this last?” and “are we once again overestimating the short-term significance and underestimating the long term impact?” To put this in context, it might be useful to look at previous hardware cycles and their characteristics as the various computing platforms have evolved over the last 60 years or so.
Chart 1: The evolution of computing platforms
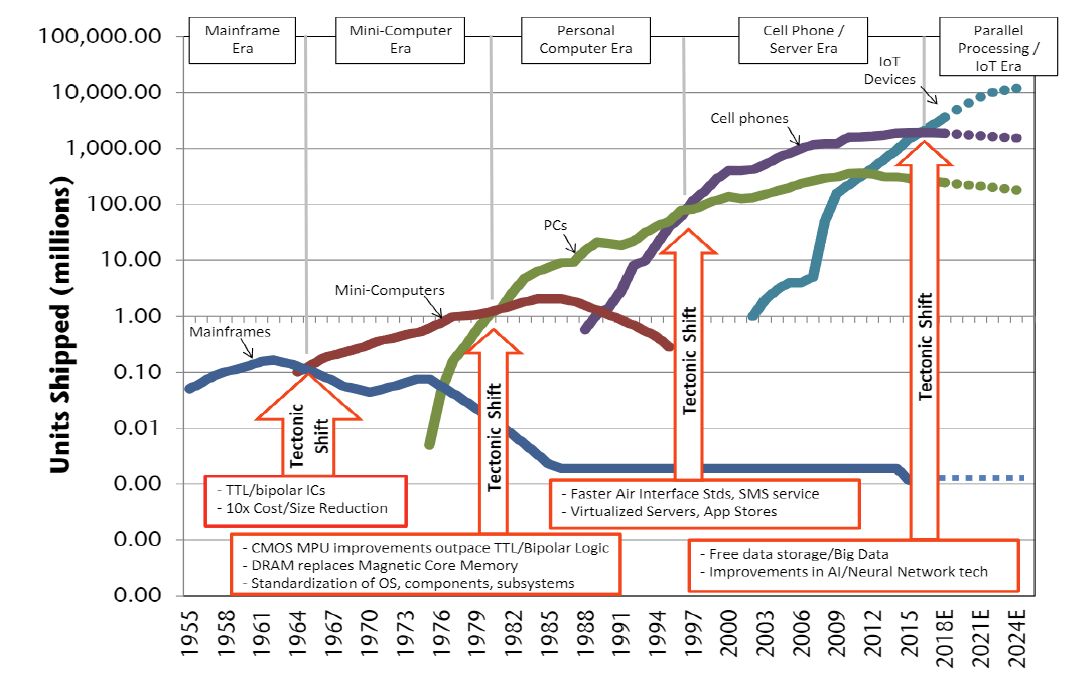
Source: Jeffries Equity Research
Chart 1 above shows the evolution of computing platforms since the 1950s. We can see that each era lasts around 10 to 15 years and with each passing cycle, the number of devices connected to the network has increased tenfold. As a result, technology has penetrated more and more industries and been applied to more and more aspects of everyday life. What is less clear from the chart is that in each era, there has been one or two companies that have typically captured 80% or more of the hardware value chain. IBM in the mainframe era, DEC in mini-computers, Microsoft /Intel in PCs, Nokia and then Apple in cell phones and so far Nvidia in the parallel processing/IoT era powered by an AI datacentre at its core.
It's probably fair to assume that we are likely in the early stages of the AI-related infrastructure build, perhaps at a point equivalent to the mid-1990s when the internet was still being constructed. While this rapid growth phase for hardware is likely to slow down, there is still a long runway of adoption to go if prior cycles are any guide. One significant difference between the AI infrastructure boom and the growth in fixed and mobile internet infrastructure is the fact that the internet rollout was largely financed by debt raised by telecom companies and IPOs raised by often loss-making early stage companies. Today’s AI infrastructure, however, is being built using cash flows from large and very profitable businesses. This factor alone may give the hardware cycle more longevity than its predecessors.
In terms of applications and profitable use cases for AI, it appears that we are in a position similar to the mid-to-late 1990s when the internet was being developed. Back then, we expected navigation, entertainment and e-commerce would likely become the main applications for the internet. It took a further decade for the smartphone to reach the mass market and fully enable the potential of the network, allowing companies like Apple, Meta Platforms, Alphabet, Amazon and others to flourish. AI may yet be applied to new industries and revolutionise the competitive landscapes therein. Drug discovery, self-driving cars, media content production and software code writing could all become the main applications for AI in the longer term. However, it is too early to make definitive predictions.
The emerging risk of a classic hype cycle seems fairly clear. If profitable use cases are not delivered soon enough, this may slow the infrastructure boom. This was certainly the case in the late 1990s early 2000s. However, back then the internet infrastructure collapsed under an unsustainable mountain of debt, which was paid out in the form of expensive 3G licences. During this period, Apple disrupted the telecom value chain with the power of iTunes and then the smartphone. This time, the spending is funded by cash flow and earnings, and while it may slow down, it seems unlikely to collapse any time soon.
In conclusion, the impact of AI clearly has the scope to be far-reaching and is likely a factor investors will have to contend with for a long time to come.
Q2: Will the market leadership broaden beyond technology names into other sectors?
The possibility of stock market leadership broadening beyond technology names and into other sectors, in our view, depends on several factors. These include economic conditions, the level of real rates, sector-specific earnings, cash flow developments and investor sentiment.
In general, market leadership so far in 2024 has been driven by upgrades in earnings and cashflow. Five mega-cap AI stocks—Nvidia, Alphabet, Amazon, Meta and Microsoft—have accounted for almost all of the market’s return. However, value stocks in areas such as energy, banking and insurance have also performed well, while defensives such as consumer staples and healthcare have largely underperformed. The market seems to be assuming that we are in the middle of a business cycle of indeterminate length—all underpinned by a gradual disinflationary environment. It is only natural to question if this is a fair assessment. Does it all add up? How should we construct portfolios in this environment?
So far in 2024, changes in earnings have had a greater influence on the market than changes in real interest rates (Chart 2). The chart shows how much of the returns can be explained by changes in earnings. Rather ominously, similarly high readings were seen just before major market events, such as the Asian financial crisis of 1998, the dot.com bust of 2000, and arguably, the Global Financial Crisis (GFC) of 2007/2008 and the European debt crisis of 2012.
Chart 2: Proportion of S&P 500’s large-cap stock returns attributable to changes in earnings
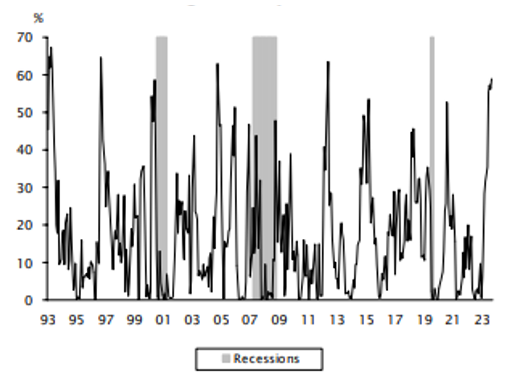
Large capitalisation stocks’ share of the return dispersion explained by the dispersion in earnings surprise measured over nine-month windows from 1993 through mid-May 2024. Past performance is not indicative of future performance.
Source: Empirical Research Partners
Naturally, investors are wondering if there is something equally damaging around the corner which may cause this benign central scenario to unravel. If we examine each factor, listed below, we may be able to draw some conclusions.
Sustainability of the AI boom and technology valuations
As mentioned in the answer to the previous question, we are still relatively early in the roll out of the next generation of a global computing platform with AI data-centres at its core. Given that the capital expenditure is largely being funded via cash flow and operating earnings, there doesn’t seem to be a reason for the spending to come to a juddering halt any time soon. There may be disappointment over the lack of profitable applications (similar to the experience during the internet boom), which may cool investor sentiment. However, so far, the improvements in earnings and cash flow appear sustainable and are certainly far more attractive than those being produced by many other parts of the economy.
Is the disinflationary consensus appropriate?
It’s been over four years since the pandemic stopped the global economy in its tracks. The unprecedented economic standstill and the incredible degree of stimulus that supported the recovery meant that these circumstances were truly unique. But is this still the case? There are clear signs that we are approaching a new normal. The US labour market is coming back into balance following the large-scale retirements of baby boomers during the pandemic and low immigration levels, which led to the tightest labour conditions since World War 2. Now, a recovery in net migration and higher female labour participation has brought the jobs market into balance, leading to a cooling of wage inflation.
In addition to a modest cooling in labour conditions, the shelter component of the CPI is also beginning to moderate. The increase in mortgage rates has caused homeowners in the US to stay put, as moving could result in mortgages being repriced to unaffordable levels. This has dramatically cut the supply of single-family homes in the market. However, the number of apartments under construction is now at highs not seen since the 1970s; vacancy rates are normalising, suggesting the pressure on the CPI from the shelter component should continue to ease.
The relative health of the jobs market has also helped offset the drawdown in consumers’ excess savings, which are now nearly exhausted. Despite the rapid tightening in monetary policy by the Federal Reserve, consumers, in general, have remained in reasonable shape. Conditions have undoubtedly been tough for those in the lowest parts of the income distribution, but even here, wage growth is at least keeping pace with inflation in necessities and debt service costs. In addition, consumers in the top quintile of the income distribution, who account for nearly 40% of all spending, actually benefit from higher rates.
What are the prospects for other sectors?
If our central scenario suggests that we are in the middle of a cycle where corporate earnings power is beginning to accelerate as the economy achieves a soft landing, then we must consider the prospects for other sectors and the longer-term level of real interest rates when we think about these opportunities.
Given the context of challenging geopolitical conditions, trade barriers and the prospect of a heavy supply of US Treasuries (USTs), it may be prudent to assume that the level of real rates should be higher in the next decade than it has been for the last 10 years. If this is the case, then the prospect for cyclical value sectors could be quite positive, provided that credit quality remains strong. Banks, insurers, some industrials and potentially energy sectors could see their earnings prospects fare relatively well in this scenario. Given the compelling valuation starting point, earnings upgrades for these industries could be accompanied by rising share prices. If this were to occur during a slowdown in the AI boom, these industries could take the lead in the market.
But what about defensives?
In 2024, sectors historically correlated with the fortunes of the bond market have proven something of a disaster as their yield advantage has been eroded. The valuations of these sectors, such as consumer staples and healthcare, are now arguably reaching levels where the risk-reward looks very attractive. For this to bear fruit however, we need a major dislocation in the market from a growth perspective and for the economy to endure a hard landing. This seems unlikely today but given the tense state of geopolitics and the major election cycle currently taking place, the benefits of diversification should not be underestimated over the longer term.
Q3: What are the main risks and challenges equity investors may face in the remainder of 2024?
Whether it’s about the level of the CPI, the direction of economic growth, credit quality in the consumer and corporate sector, the housing market, supply of USTs, elections, geopolitics or even an outright stock market bubble, the list of investor worries and concerns seems as long as one can remember. Yet the market continues to push higher. Are we headed for a fall or are we in an economic sweet spot with moderate growth and declining inflation that could go on for some time?
Like any journey, to really understand the benefits of the destination, we should also understand our starting point. Taking a long-term view makes this a little more straightforward and likely helps us draw some better insights, given the myriad of potential outcomes which exist in the short-term. The last 15 years have been characterised by unprecedented fiscal and monetary stimulus to keep the cost of money low following the GFC and more recently to support economies during the pandemic. The low cost of capital reached a pinnacle in a 2021 stock market bubble of money-losing growth stocks, which burst spectacularly as the cost of money increased.
The next 15 years seem unlikely to be a repeat of the last 15, with the direction of real rates being the primary concern for investors. Our best guess is that we are now faced with a sustainably higher cost of capital than the abnormally low level we witnessed following the GFC. A number of factors contribute to this, including (but not limited to) the high forthcoming supply of government debt to fund a burgeoning fiscal deficit, the impact of geopolitics on trade restrictions and the inflationary implications of the energy transition.
If real rates are indeed set to rise over the next decade or so, this will have implications for stock picking as immediate profits become more valuable to investors than the hope of potential profit a decade from now. This might explain why the companies in the market related to the AI theme are performing so well, as they are also experiencing sharp increases in earnings and cash flow. This contrasts sharply with long-duration growth stocks, which continue to lag the market as the anticipated earnings for 2035 or beyond remain just that—hope.
Yet, perhaps the biggest risk to investors with time horizons of 10 years or more is missing out on the opportunities a well-diversified portfolio of global equities can offer. As a smart investor once said, “time in the market is far more important than timing the market”. This seems as true today as ever. We are on the verge of a further breakthrough in productivity, enabled by the ongoing evolution of computing platforms, and we stand ready to tackle arguably the most pressing challenge in human history—climate change. Throughout history, equity investors have benefitted from maintaining a long-term view and an optimistic outlook on humanity’s ability to prevail in the face of adversity. This might once again be the case, meaning that the biggest risk might be not having exposure to the highest quality earnings streams through a diversified portfolio of global equities. Perhaps we have already mentioned that we know professionals who can be of assistance in such matters.
Global Equity strategy composite performance to June 2024
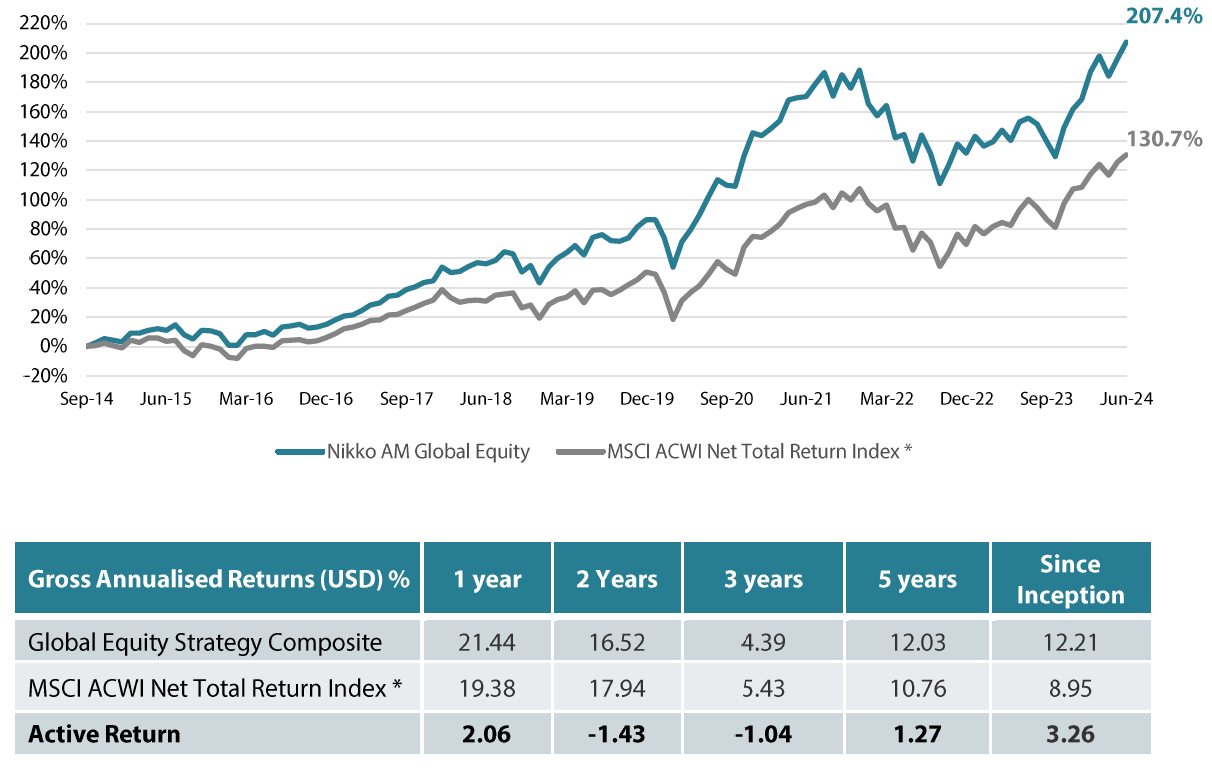
Past performance is not a guide to future returns.
*The benchmark for this composite is MSCI ACWI Net Total Return Index. The benchmark was the MSCI ACWI ex AU since inception of the composite to 31 March 2016. Inception date for the composite is 01 October 2014.
Returns are based on Nikko AM’s (hereafter referred to as the “Firm”) Global Equity Strategy Composite returns. Returns for periods in excess of 1 year are annualised. The Firm claims compliance with the Global Investment Performance Standards (GIPS ®) and has prepared and presented this report in compliance with the GIPS. GIPS® is a registered trademark of CFA Institute. CFA Institute does not endorse or promote this organization, nor does it warrant the accuracy or quality of the content contained herein. Returns are US Dollar based and are calculated gross of advisory and management fees, custodial fees and withholding taxes, but are net of transaction costs and include reinvestment of dividends and interest. Copyright © MSCI Inc. The copyright and intellectual rights to the index displayed above are the sole property of the index provider. Any comparison to a reference index or benchmark may have material inherent limitations and therefore should not be relied upon. To obtain a GIPS Composite Report, please contact This email address is being protected from spambots. You need JavaScript enabled to view it.. Data as of 30 June 2024.
Nikko AM Global Equity: Capability profile and available vehicles
(as at June 2024)
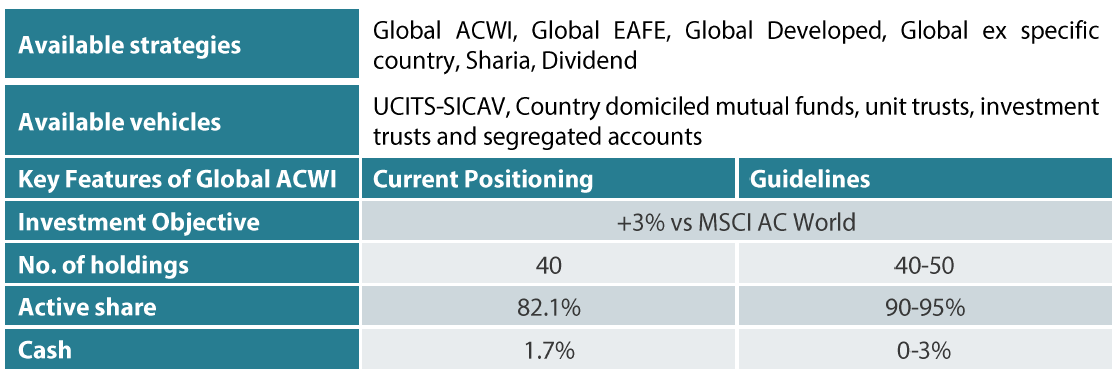
Target return is an expected level of return based on certain assumptions and/or simulations taking into account the strategy’s risk components. There can be no assurance that any stated investment objective, including target return, will be achieved and therefore should not be relied upon. Any comparison to a reference index or benchmark may have material inherent limitations and therefore should not be relied upon.
Past performance is not indicative of future performance. This is provided as supplementary information to the performance reports prepared and presented in compliance with the Global Investment Performance Standards (GIPS®). GIPS® is a registered trademark of CFA Institute. Nikko AM Representative Global Equity account. Source: Nikko AM, FactSet.
Nikko AM Global Equity Team

This Edinburgh based team provides solutions for clients seeking global exposure. Their unique approach, a combination of Experience, Future Quality and Execution, means they are continually “joining the dots” across geographies, sectors and companies, to find the opportunities that others simply don’t see.
There are four key areas that make our strategy different:
a focus on Future Quality companies – a different and clear philosophy
a distinctive team culture – a tight-knit team with a process built on openness and respect
unique execution, including rigorous team challenge of every idea
differentiated portfolios, with a strong track record in stock-picking and ESG integration
Future Quality companies
We believe that companies with superior long-term returns on investment will deliver better performance. We call these Future Quality companies, and it is only these companies that make it into client portfolios. We search for Future Quality through analysis and financial modelling of companies that we expect to deliver over the next five years, and beyond. This approach is supported by academic evidence that businesses with high and improving returns on invested capital provide superior compound performance over the long term. With this investment time horizon, the sustainability of returns is a crucial ingredient of our Future Quality approach. We have found that companies developing solutions to ESG issues and management teams providing value to all stakeholders are more likely to be successful at sustaining high returns on invested capital over the long-term.
Distinctive team structure and culture
We believe that our collective knowledge and experience are powerful tools for delivering investment performance. Since 2011, we have operated a team-based approach to uncovering Future Quality investment ideas and have fostered a strong group dynamic. Individually, each Portfolio Manager is an expert investor with a broad skillset and experience of many market cycles.
We work in a flat structure, where all our Portfolio Managers have a dual role that combines investment analysis and investment management responsibilities. With individual analytical coverage split along industry lines, each Portfolio Manager is a specialist in the stocks and sectors they cover.
We all actively challenge the ideas and analysis of colleagues throughout the investment process, in an open atmosphere of vigorous and constructive debate. Portfolio Analysts work alongside Portfolio Managers, typically researching thematic trends that could influence and uncover future investment opportunities.
We take collective responsibility for approving stocks for the portfolio, and therefore there is joint accountability for performance. As such, it is in everyone’s interest to ensure that the investment analysis is thorough and that no stone is left unturned in the search for Future Quality.
We believe that the broad experience of our Portfolio Managers and distinctive team-based approach that sees everyone contributing to the strategy, increases the probability of successfully uncovering Future Quality.
Unique execution
Our tight-knit team approach and flat structure enable us to execute in a transparent way, including a rigorous team challenge of every idea. By using our strict Future Quality standards, we can identify long-term winners from the broader universe, to narrow down a comprehensive watch list and around 100 deep dive researched ideas. This is within a unique framework of individual accountability for the underlying analysis and company research, combined with the collective challenging of assumptions at the team level. Our proprietary ranking tool creates a disciplined process to compare and rank attractive opportunities and ensures that at the portfolio construction phase, only our best-ranked ideas receive the most committed weights in client portfolios. We believe our culture is key, and the collective ownership of our research process brings the best portfolio outcomes for clients.
Differentiated portfolios
We deliver a high-conviction Global Equity strategy for clients that is not constrained by benchmarks. As such, Future Quality can be sourced from listed businesses across any geography or sector. And, in a world awash with investment prospects, our disciplined, accountable and transparent process helps us to focus solely on building portfolios from companies that best meet our specific Future Quality criteria.
In terms of balancing risk and reward, our track record shows that we consistently deliver attractive returns on a lower risk-adjusted basis compared with peers and the global reference benchmark. The high active share and concentrated number of holdings help ensure that our Future Quality stock-selection process delivers differentiated portfolios.
Risks
Emerging markets risk - the risk arising from political and institutional factors which make investments in emerging markets less liquid and subject to potential difficulties in dealing, settlement, accounting and custody.
Currency risk - this exists when the strategy invests in assets denominated in a different currency. A devaluation of the asset's currency relative to the currency of the strategy will lead to a reduction in the value of the strategy.
Operational risk - due to issues such as natural disasters, technical problems and fraud.
Liquidity risk - investments that could have a lower level of liquidity due to (extreme) market conditions or issuer-specific factors and or large redemptions of shareholders. Liquidity risk is the risk that a position in the portfolio cannot be sold, liquidated or closed at limited cost in an adequately short time frame as required to meet liabilities of the Strategy.
Any reference to a particular security is purely for illustrative purpose only and does not constitute a recommendation to buy, sell or hold any security. Nor should it be relied upon as financial advice in any way. There can be no assurance that any performance will be achieved in any given market condition or cycle. Past performance or any prediction, projection or forecast is not indicative of future performance.